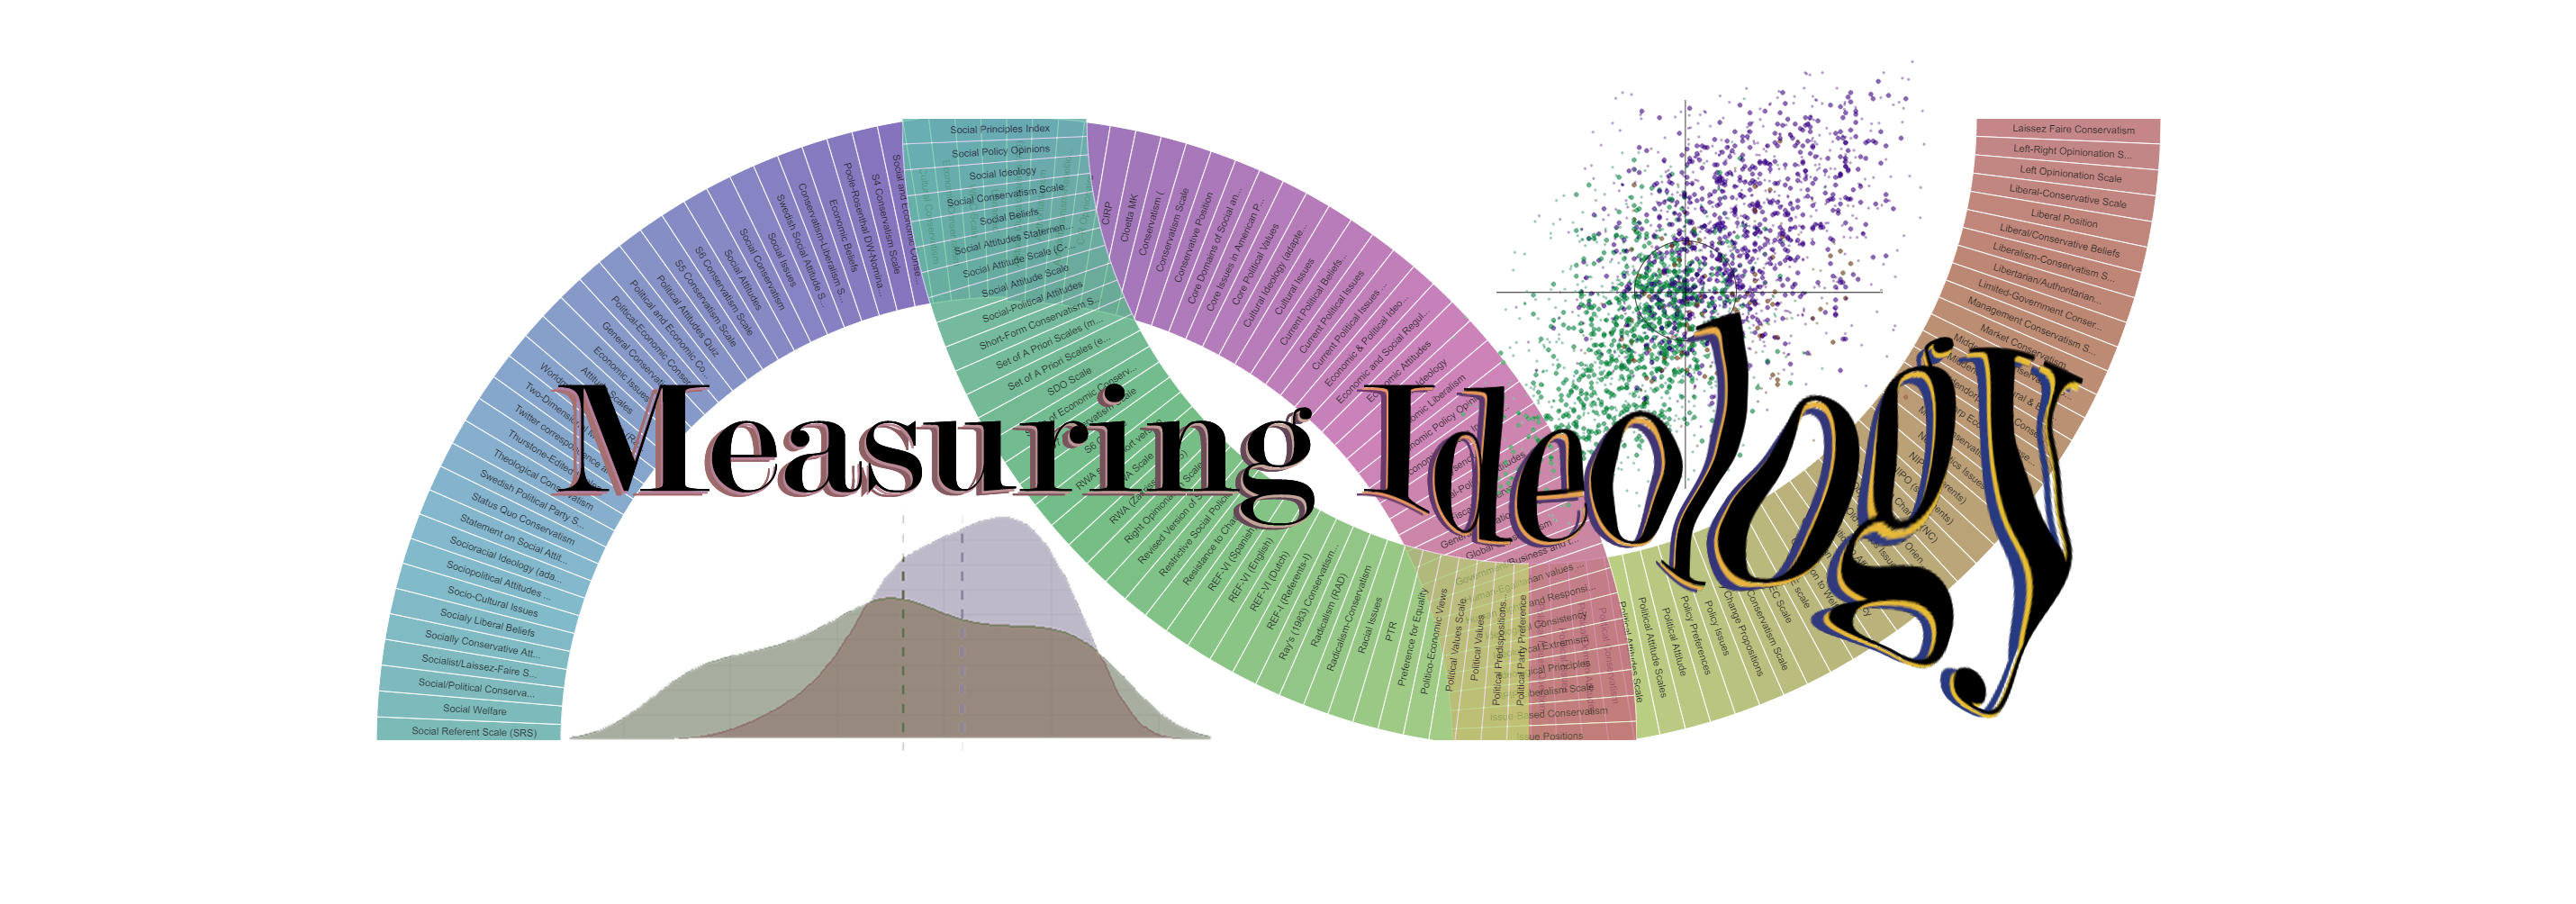
Measuring Ideology: Current practices, its consequences, and
recommendations.
Measuring Ideology: Current practices, its consequences, and recommendations.
Flavio Azevedo
Flavio Azevedo
Utrecht University, Netherlands
Contact Information
Deliah Bolesta
Deliah Bolesta
Center for Criminological Research (ZKFS), Germany
Contact Information
Alexandra ZAPKO-WILLMES
Alexandra ZAPKO-WILLMES
Universitaet Siegen, Germany
Contact Information
Philip Warncke
Philip Warncke
University of Limerick, Ireland
Contact Information
Jisu Kim
Jisu Kim
Utrecht University, Netherlands
Contact Information
11 March, 2026
11 March, 2026
Abstract
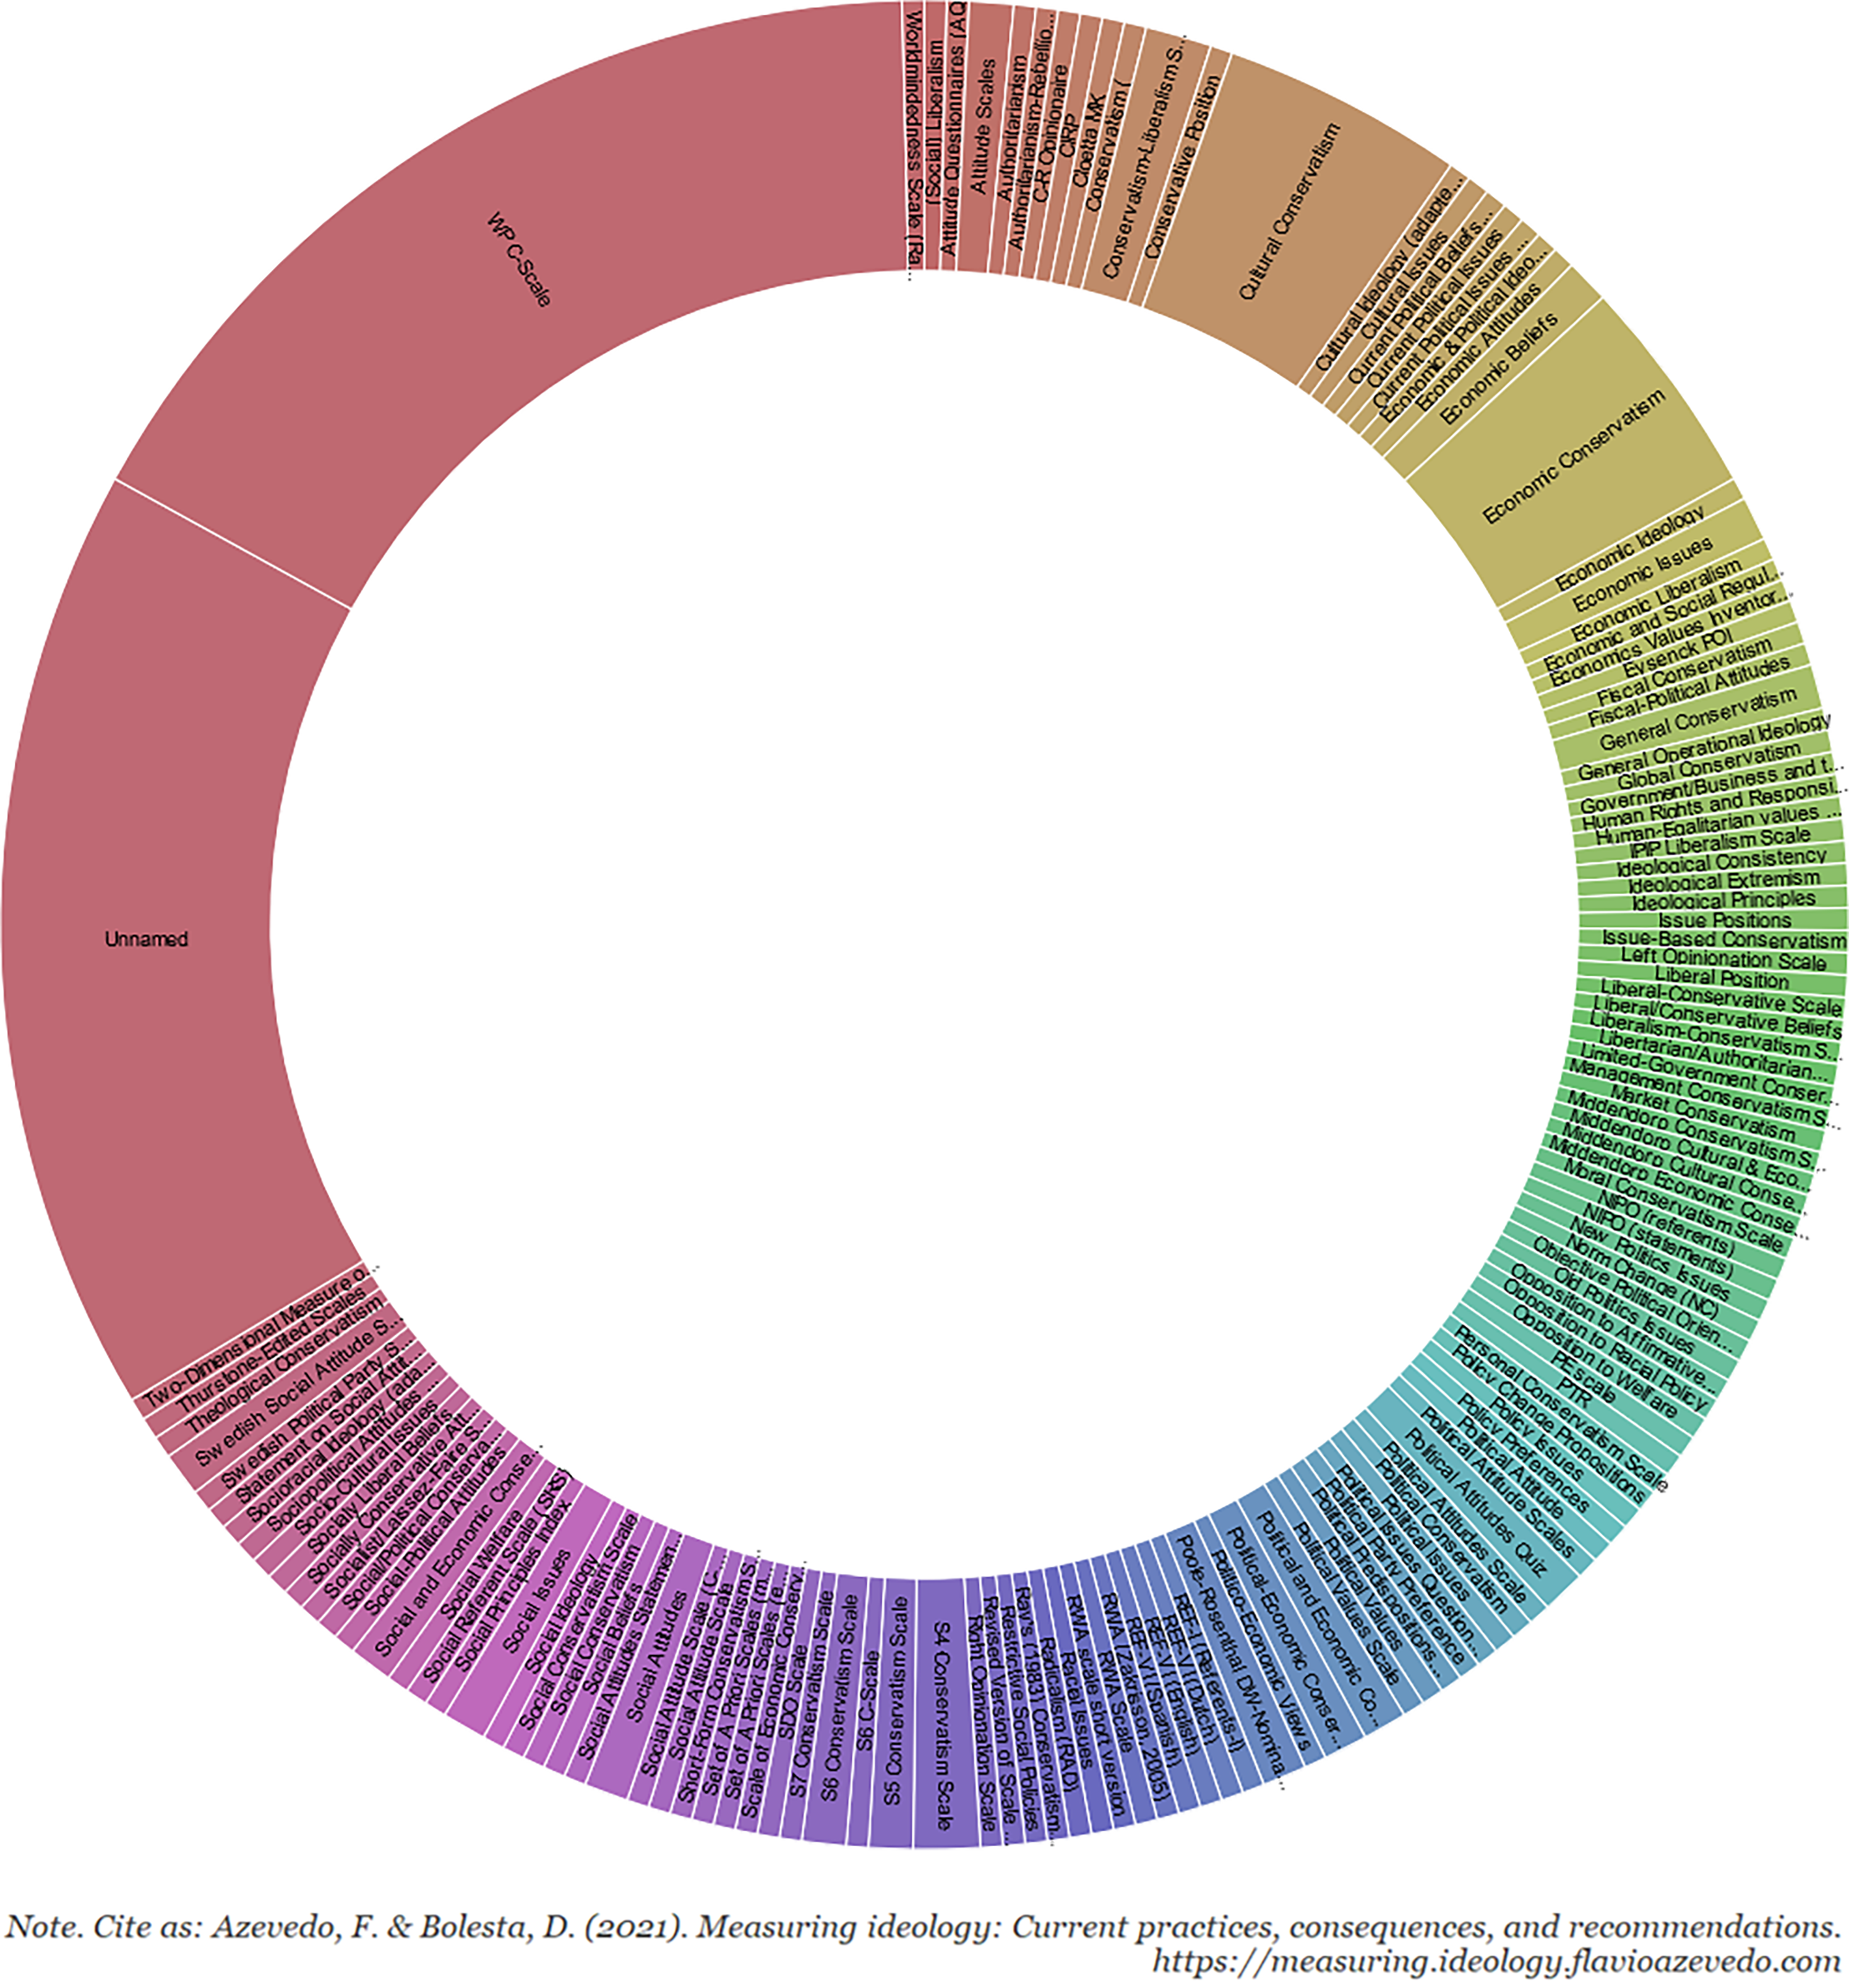
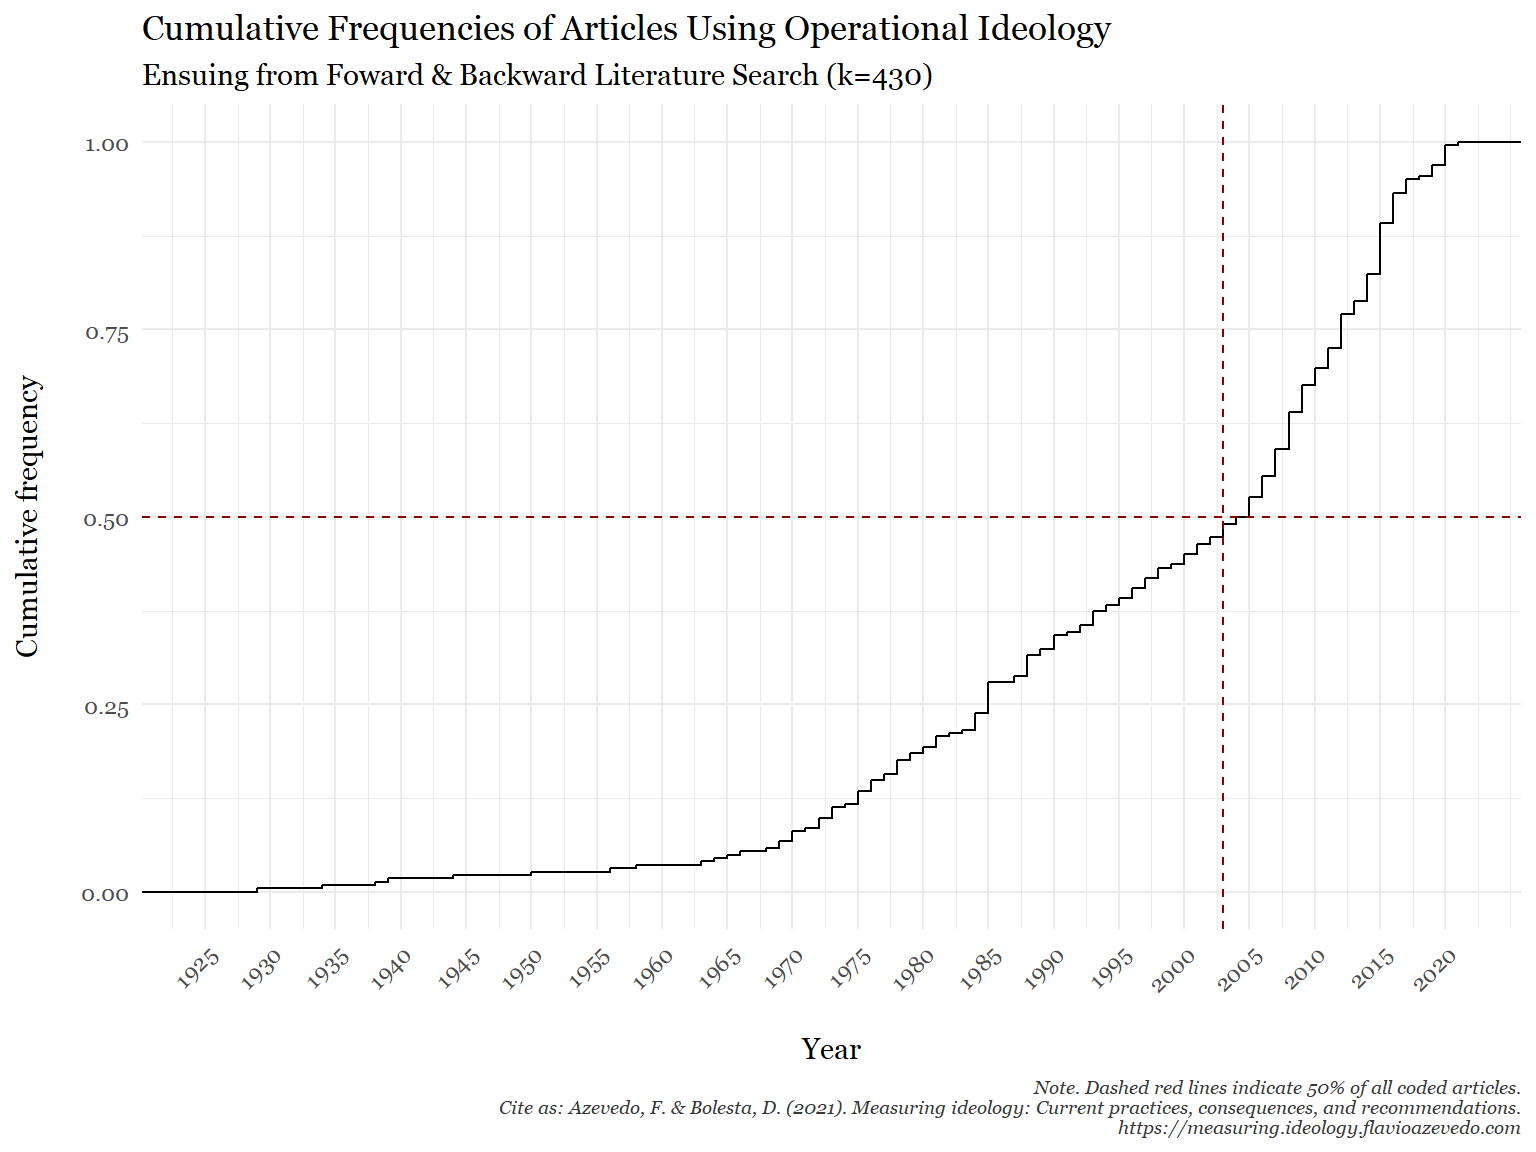
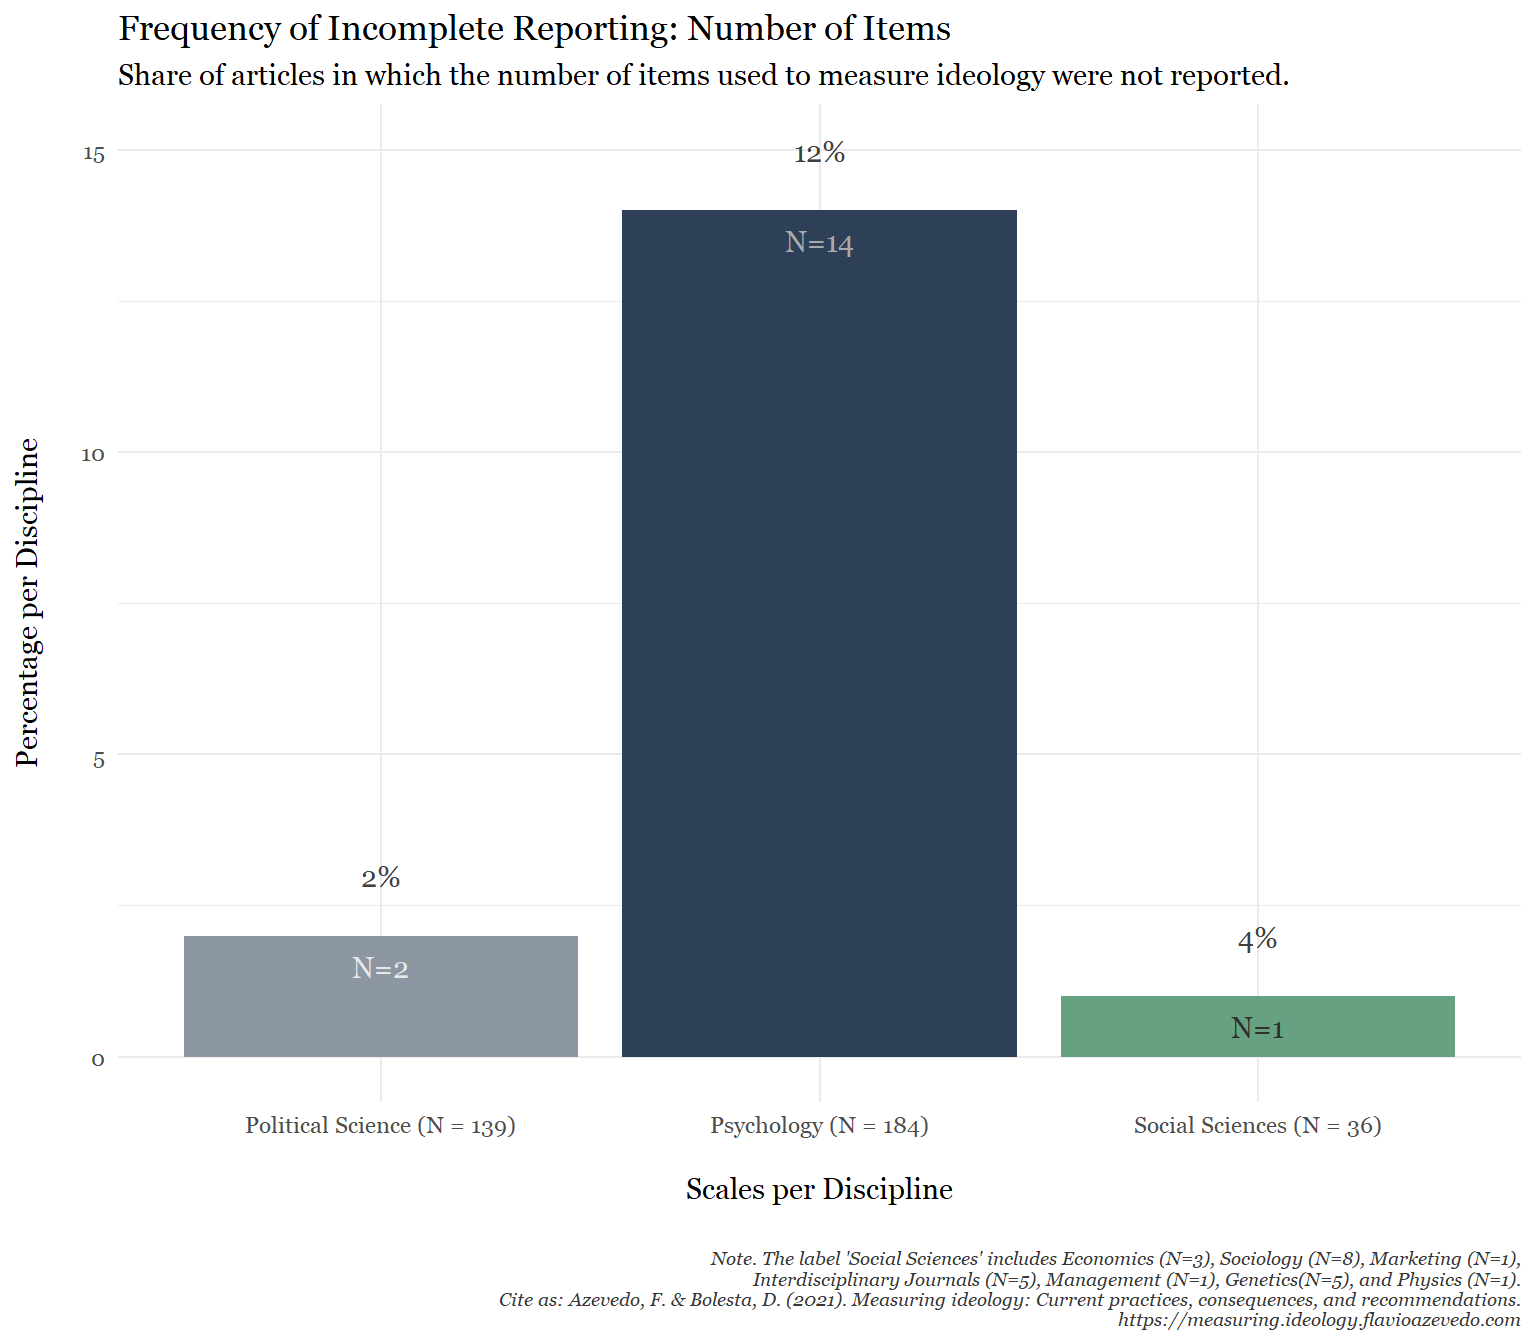
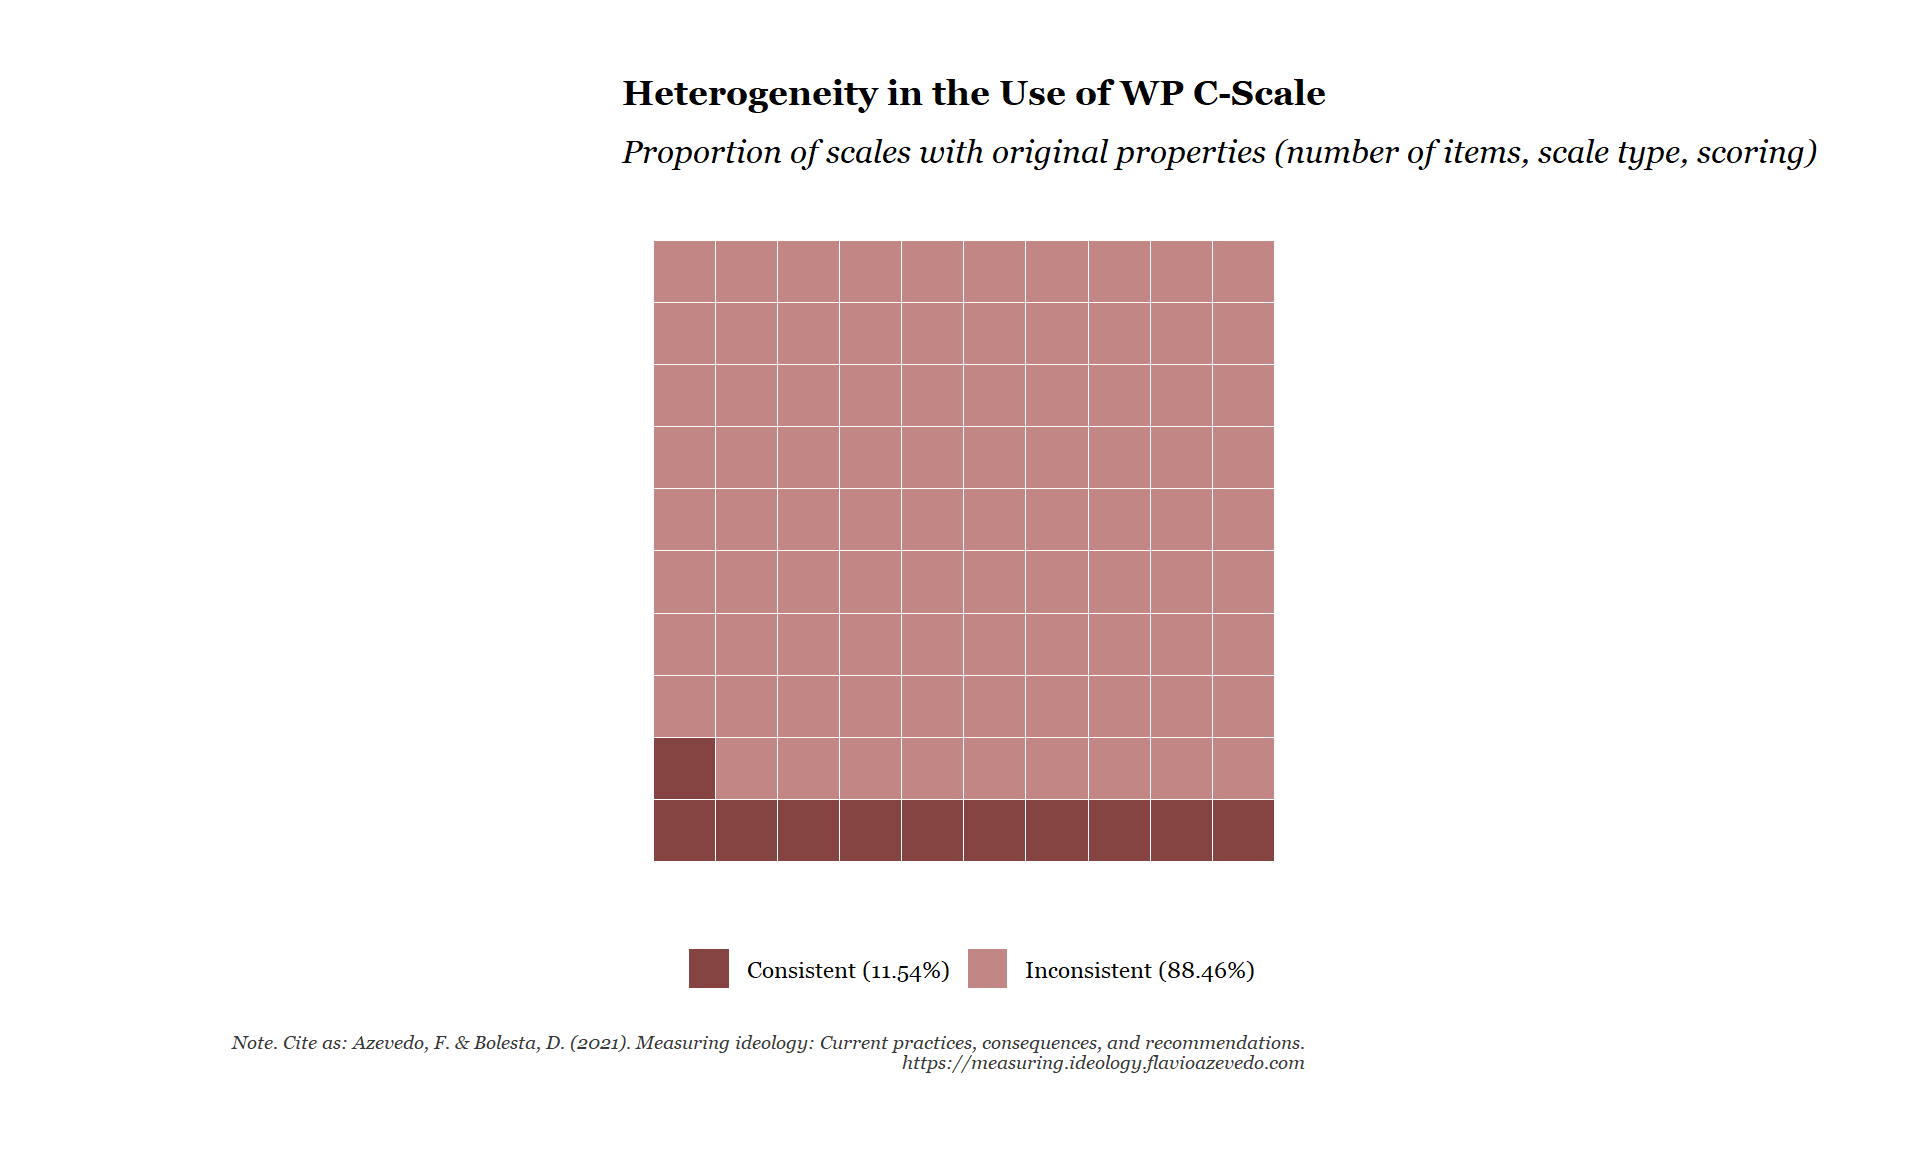
Political ideologies are foundational to a broad range of social science fields such as Political Science, and Social and Political Psychology. Ideologies serve to aid individuals navigate the complex socio-political world by offering an organization of values, justifying social arrangements, and describing power relations. Applied to research, scholars use diverse and wide-ranging approaches to the measurement of an individual’s political ideology. We sought to investigate standard practices by conducting an exhaustive literature review of over 400 scientific articles, spanning from 1930s to 2020s, across social sciences sub-fields. We found and cataloged 358 unique ideological instruments measuring the construct of ‘ideology’. We found a high frequency of incomplete reporting of the items used (37.84%), and substantial variance in scoring and scale type even within identical scales (e.g., in 11.54% was the Wilson & Patterson’s C-Scale (1968) used as suggested by the original authors). Moreover, for novel scales validity evidence was sparingly reported (48.25%), with only a few studies reporting statistical or psychometric technique (50.81%), extraction (23.39%) or rotation methods (49.19%). Results show that most ideological instruments were either on-the-fly measures (18.16%) or an ad-hoc combination of items (30.17%) present in existing, publicly available surveys. In order to estimate the extent to which operational measures of political ideology overlap regarding item contents, we conducted systematic content analyses of ten ideological scales. Data-driven inductive content analyses revealed 39 ideological topics and a weak mean topic overlap among the ten scales (Jaccard index 0.20). A more theory-driven deductive approach identified 15 topics and a similarly low mean overlap (Jaccard index 0.33). The little to no overlap in approaches to the measurement of ideology suggests that scholars may not be justified in generalizing findings across studies. However, to test this assertion —i.e., whether the routine practice to measure ideology with one ideological instrument but draw conclusions about ideology, in general, relying on the assumption that measures are interchangeable is an invalid approach— we conducted two additional studies (N_total = 3619) assessing the comparability, replicability, and validity of ideological instruments with survey data. We applied five different ideological scales to different established theories in the field and showed empirically that results indeed can change as a function of the instrument used. We conclude that findings in research programs measuring ideology—as well as the perseverance of long-standing debates on polarization, ideology in mass publics, ideological asymmetries, and social and economic ideologies as different psychological paths—are, at least in part, susceptible to the idiosyncratic use of measures of ideology and poor measurement practices in general. We then discuss its consequences and recommendations.
.
Introduction
Few concepts in science can travel across the rigid boundaries of scientific inquiry and attract scholars from different theoretical and methodological schools of thought. But ideology appears to be almost ubiquitous to sundry disciplines in both humanities and social sciences (Maynard & Mildenberger, 2018). From political science (Carmines et al., 2012; Feldman, 1988; Zaller, 1992) to intellectual history (Skinner et al., 2002; Tully, 1983), from sociology (Boudon, 1989) to political theory (Freeden, 1996), from political and social psychology (Jost et al., 2003; Skitka & Tetlock, 1993) to discourse analysis (Fairclough, 2010; Howarth et al., 2000), scholars devoted significant resources to the analysis of ideology. The collective body of ideological research can be thought of as being held by three pillars, a conceptual, a discursive, and a quantitative one (Maynard, 2013). The first approach focuses on the etiology and ideational content of these sets of beliefs; the second emphasizes the importance of the mediums through which ideology is expressed (i.e., discursive and communicative practices, as well as institutional structures); while the last studies the role of dispositional factors and situational processes underlying ideological proclivities. The study of political ideologies in mass publics is foundational to a broad range of disciplines in Social Sciences such as Political Science, Behavioral Economics, and Social and Political Psychology. One’s ideological beliefs are studied as a dependent variable (Ansolabehere et al., 2008), predictor (Mills et al., 2016), covariate (Sidanius et al., 1996), moderator (Onraet et al., 2013) and mediator (Van Hiel et al., 2004). But despite its almost ubiquitous prevalence, there is still lively debate on whether people can indeed be considered ideologues (Conover & Feldman, 1984; Converse, 1964; Feldman, 1988; Goren, 2001, 2012; Hochschild, 1981; Jacoby, 2006; Zaller, 1992), on which elements and politico-psychological processes help structure individuals’ political beliefs (Duckitt, 2001; Haidt & Joseph, 2007; Jost et al., 2003; Tomkins, 1963), and on how these mental representations can be empirically evaluated (Carmines et al., 2012; Ellis & Stimson, 2009; Feldman & Johnston, 2014; Fuchs & Klingemann, 1990; Jost et al., 2009; von Collani & Grumm, 2009). To shed some light into these enduring questions, social scientists resorted to interviews and subsequent analyses of responses to political questions, in mostly two approaches. On one hand, political scientists typically make use of a selected number of political attitudes questions present in national election studies and cross-national surveys. Other streams of inquiry tended to opt for fashioning and employing their own surveys and inventories aiming to tap into the same ideological beliefs. Taken together, the widespread use and impact of ideological instruments across political science and social sciences, more broadly, suggests considerable resources have been devoted to this empirical approach.
However, this practice may be problematic for at least two reasons. First, it is standard practice to tacitly assume ideological inventories can be used interchangeably. That is, to conduct research based on one specific instrument, or a specific choice for set of survey items, but draw conclusions about the nature of ideology in general – not the specific operationalization. This untested assumption, if shown not to hold, may pose a threat to the comparability and generalizability of findings. That is, results may be idiosyncratic to the respective instrument. Second, while the construction of multiple measures of the same construct can be convenient, it is unlikely that these are equally valid indicators of ideological content or tapping into the same construct. As political and politico-psychological phenomena are mostly latent – in that the construct of interest is not directly observable – instruments require appropriate psychometric development and validation (Flake et al., 2017). This is because latent variable models assume a common cause underlying their covariance, which practically is to say scores on ideological instruments are indicative of the degree to which a person adheres to an ideology. This interpretation is credible if substantive (e.g., construct conceptualization, breadth and depth of construct, content relevance and representativeness), structural (e.g., item analysis, reliability common factor, measurement invariance) and external validity (e.g., convergent, discriminant, predictive and criterion) evidence is assured. Indeed, it has been shown that the lack of psychometric assessment may affect the verity of reported findings, as well as its replicability (Fabrigar & Wegener, 2016).
Nevertheless, there is not as of yet a study systematically evaluating measurement practices of ideology. This series of studies aims to fill this gap. Consequences and Reccomendations are discussed.
Methods
Sampling and Data Sources
To analyze measurement practices in the literature, We followed J. Webster and Watson’s (2002) recommendations for systematic literature studies, in line with guidelines for making research syntheses more transparent and easier to replicate (Atkinson, Koenka, Sanchez, Moshontz, & Cooper, 2015). The authors argue for the use of both forward and backward snowballing search (i.e., from the reference lists and citations of selected relevant literature) as the main and appropriate method for literature search procedures. Jalali and Wohlin (2012) compared this technique to more traditional approaches via keywords in reference databases (e.g., Kitchenham & Charters, 2007) and found no major differences between the findings of either analysis. The present approach ensures that the resulting dataset paints an accurate description and development of ideology as a construct, as well as of the myriad of approaches, methodologies, and analyses leveraged in its history. With this goal in mind, seven papers were selected as the starting set from leading journals in areas using ideological instruments. Our criteria for identifying papers with ideological scales were not only based on journal impact and citations but also relative to their representation in terms of both theoretical and methodological characteristics (e.g., dimensionality, field, sample type and size). The selected ideological instruments were also balanced with respect to unidimensional vs. multidimensional conceptualizations of ideology, they had been published in psychological, communication and political science disciplines, cut across academia and industry, utilized varying degrees of psychometric methods, and figured both representative, adult and large samples, as well as convenient, small, student samples.
In specific, the first instrument was the classic Conservatism Scale by Wilson and Patterson (1968) which is the most cited conservatism scale according to Google Scholar (N = 745). The second and third were the refined and validated successors of the Conservatism Scale, Social Conservatism (Henningham, 1996) and Economic Conservatism (Henningham, 1997). The fourth ensues from a nonpartisan, independent, American think tank, the Pew Research Center (2012) which developed the Core Issues in American Politics (also used in Zell & Bernstein, 2014). The fifth selected scale, Core Domains of Social and Economic Conservatism was developed by political scientists and its indices were present in several waves of the reputable American National Election Studies (ANES; Feldman & Johnston, 2014). The sixth instrument, Political Issue Statements (Inbar, Pizarro, & Bloom, 2009) and the seventh, Social and Economic Conservatism Scale (Everett, 2013) both stem from psychological science while adopting widely contrasting conceptual and methodological approaches.
Inclusion Criteria
For this review, we included empirical studies where at least one operational measure of conservatism was used. Studies that used only either symbolic ideology (i.e. ideological self-placement), a measure of Right Wing Authoritarianism (RWA) or Social Dominance Orientation (SDO) as proxy, were excluded from further analysis. A total of N = 430 initially identified articles were reviewed of which n = 93 were either meta-analyses, reviews or did not measure political ideology. 48 articles had to be excluded because they were not or only partially accessible online. A total of n = 60 studies used ideological self-placement, or an RWA or SDO measure (n = 7) for the operationalization of Conservatism only (see flowchart below for an overview).
Backward & Forward Search
Seven papers were selected as the starting set from leading journals in areas using ideological instruments. Our criteria for identifying papers with ideological scales were not only based on journal impact (Mdn = 2.56, SD = 0.95) and citations (Mdn = 177, SD = 309.37) but also relative to their representation in terms of both theoretical and methodological characteristics (e.g., dimensionality, field, sample type and size). The selected ideological instruments are also balanced with respect to unidimensional vs. multidimensional conceptualizations of ideology, are published in psychological, communication and political science disciplines, cuts across academia and industry, utilize varying degrees of psychometric methods, and figure both representative, adult and large samples, as well as convenient, small, student samples.
- C-Scale (Wilson & Patterson, 1968)
- Social Conservatism (Henningham, 1996)
- Economic Conservatism (Henningham, 1997)
- Core Issues in American Politics (Pew Research Center, 2012; Zell & Bernstein, 2014)
- Core Domains of Social and Economic Conservatism (Feldman & Johnston, 2014)
- Political Issue Statements (Inbar, Pizarro, & Bloom, 2009)
- Social and Economic Conservatism Scale (Everett, 2013)
Corpus
The final sample of N = 222 articles were coded by two independent junior coders and checked for correctness by a senior coder. Any inconsistent or ambiguous case was discussed with a second senior coder before making a final decision, resulting in a single accurate data set for analysis. Both junior coders held an undergraduate degree in social sciences and had received both, formal training in measurement, research practices, and statistics as part of their education, and a specific training on the coding of this project by the senior coders. Senior coders held postgraduate degrees in psychology at the time of coding with formal training and practical experience in measurement, research practices, and statistics.
For each of the 222 articles examined we coded meta-information (year of publication, name of author(s), scientific discipline, publication outlet), sample specifics (national origin of sample, type of sample, sample size), study specifics (number of studies within article, number of relevant measures within article), measurement specifics (name of relevant measure, novelty of measures, number of items for each measure, type of scale, lower and upper limit of scale, scoring of items, and whether or not all items or example items were provided), and information on construct validation (presence of validation evidence for measures used, use of factor analytical methods, type and technique of factor analysis, rotation and extraction method used in factor analysis).
Results
Meta-information
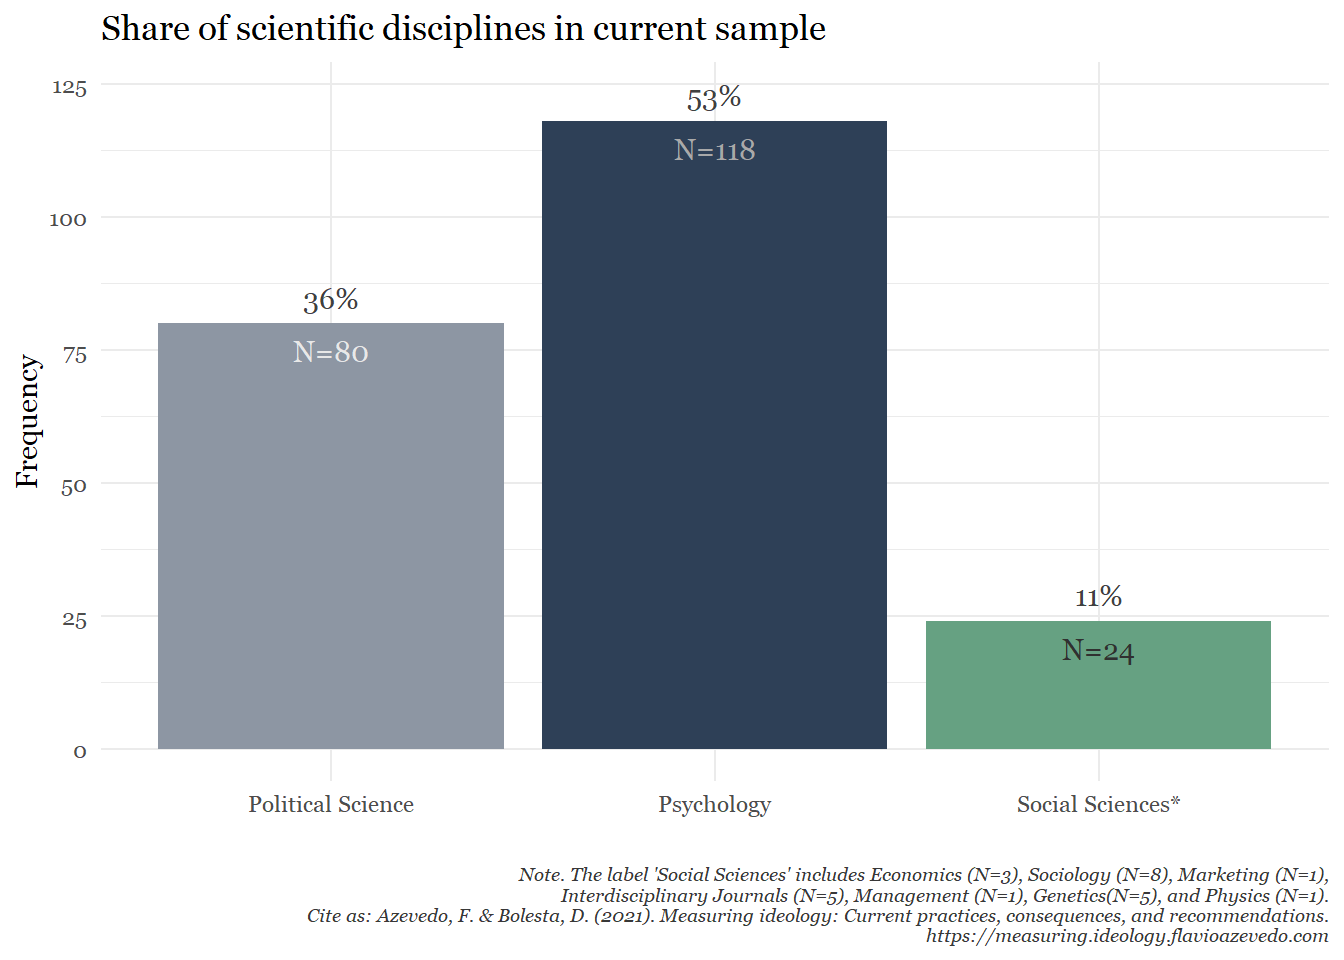
Articles Reviewed per Discipline
All Scales
Scales By Discipline
Scales Ranking
Trends in time
Rate of Publications in Time
Broken-down by Discipline
Empirical Distribution Function
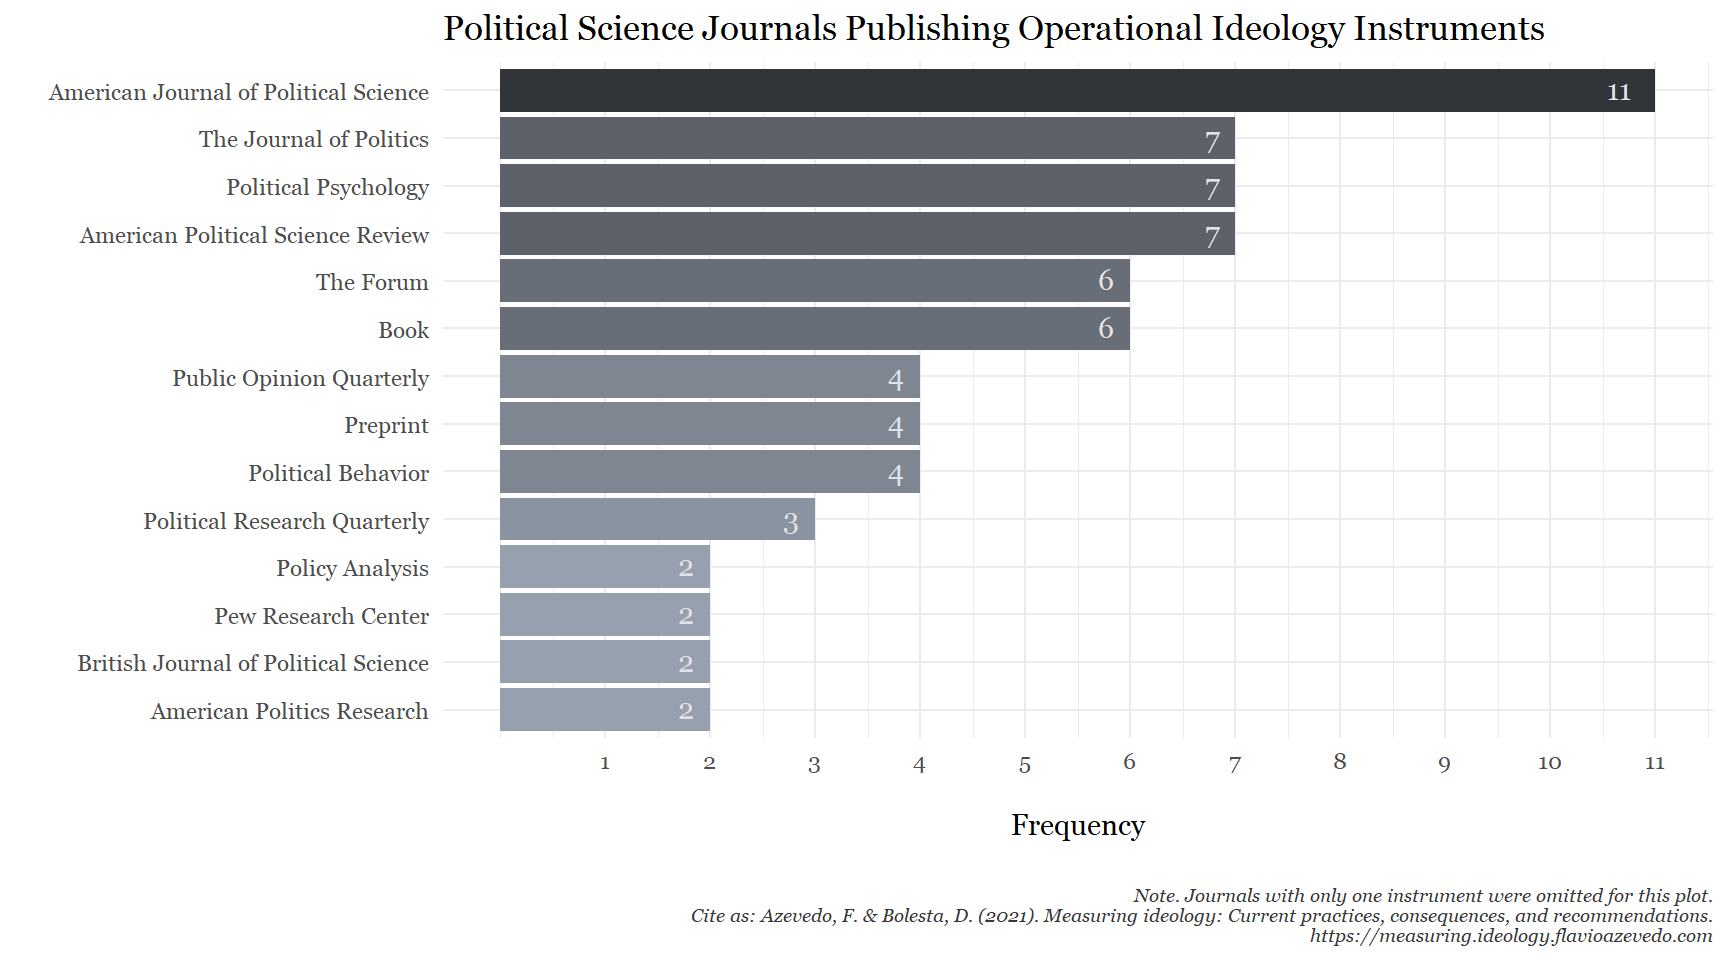
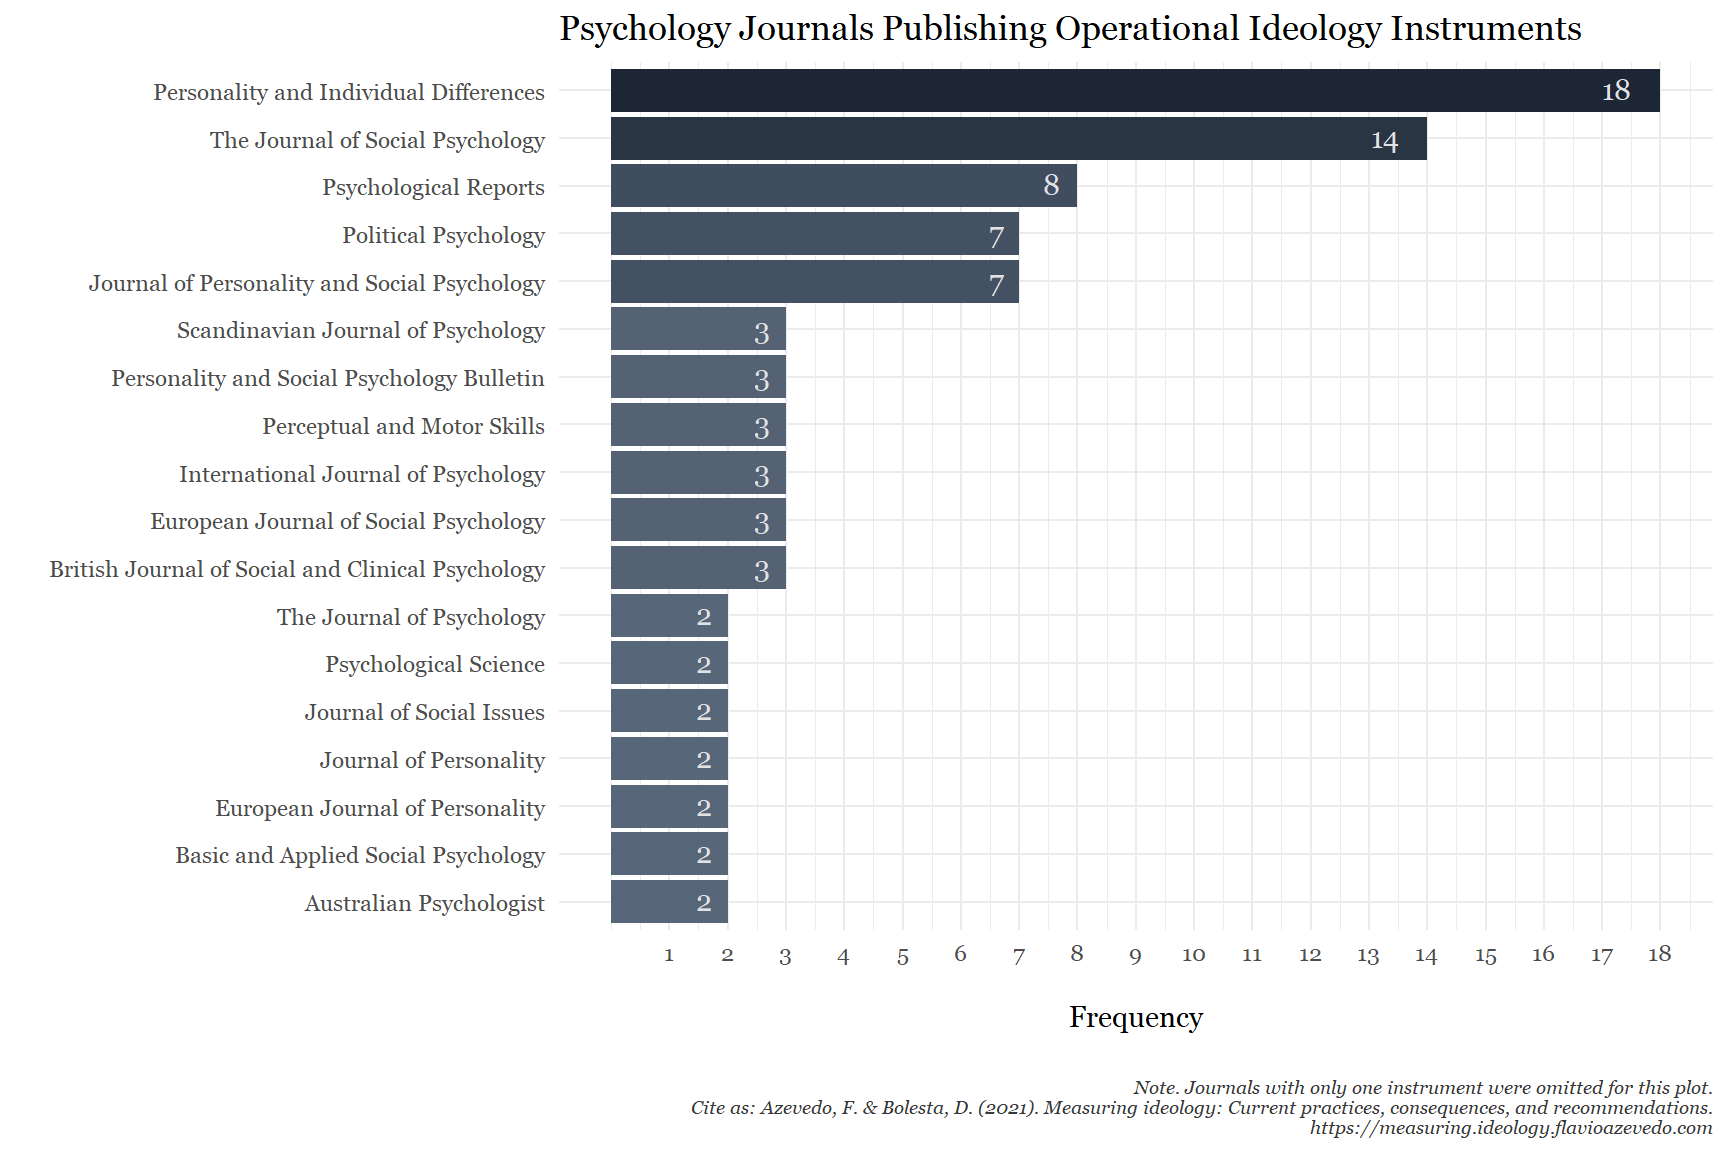
Publication Outlets
Political Science
Psychology
Overview
Sample Size & Composition
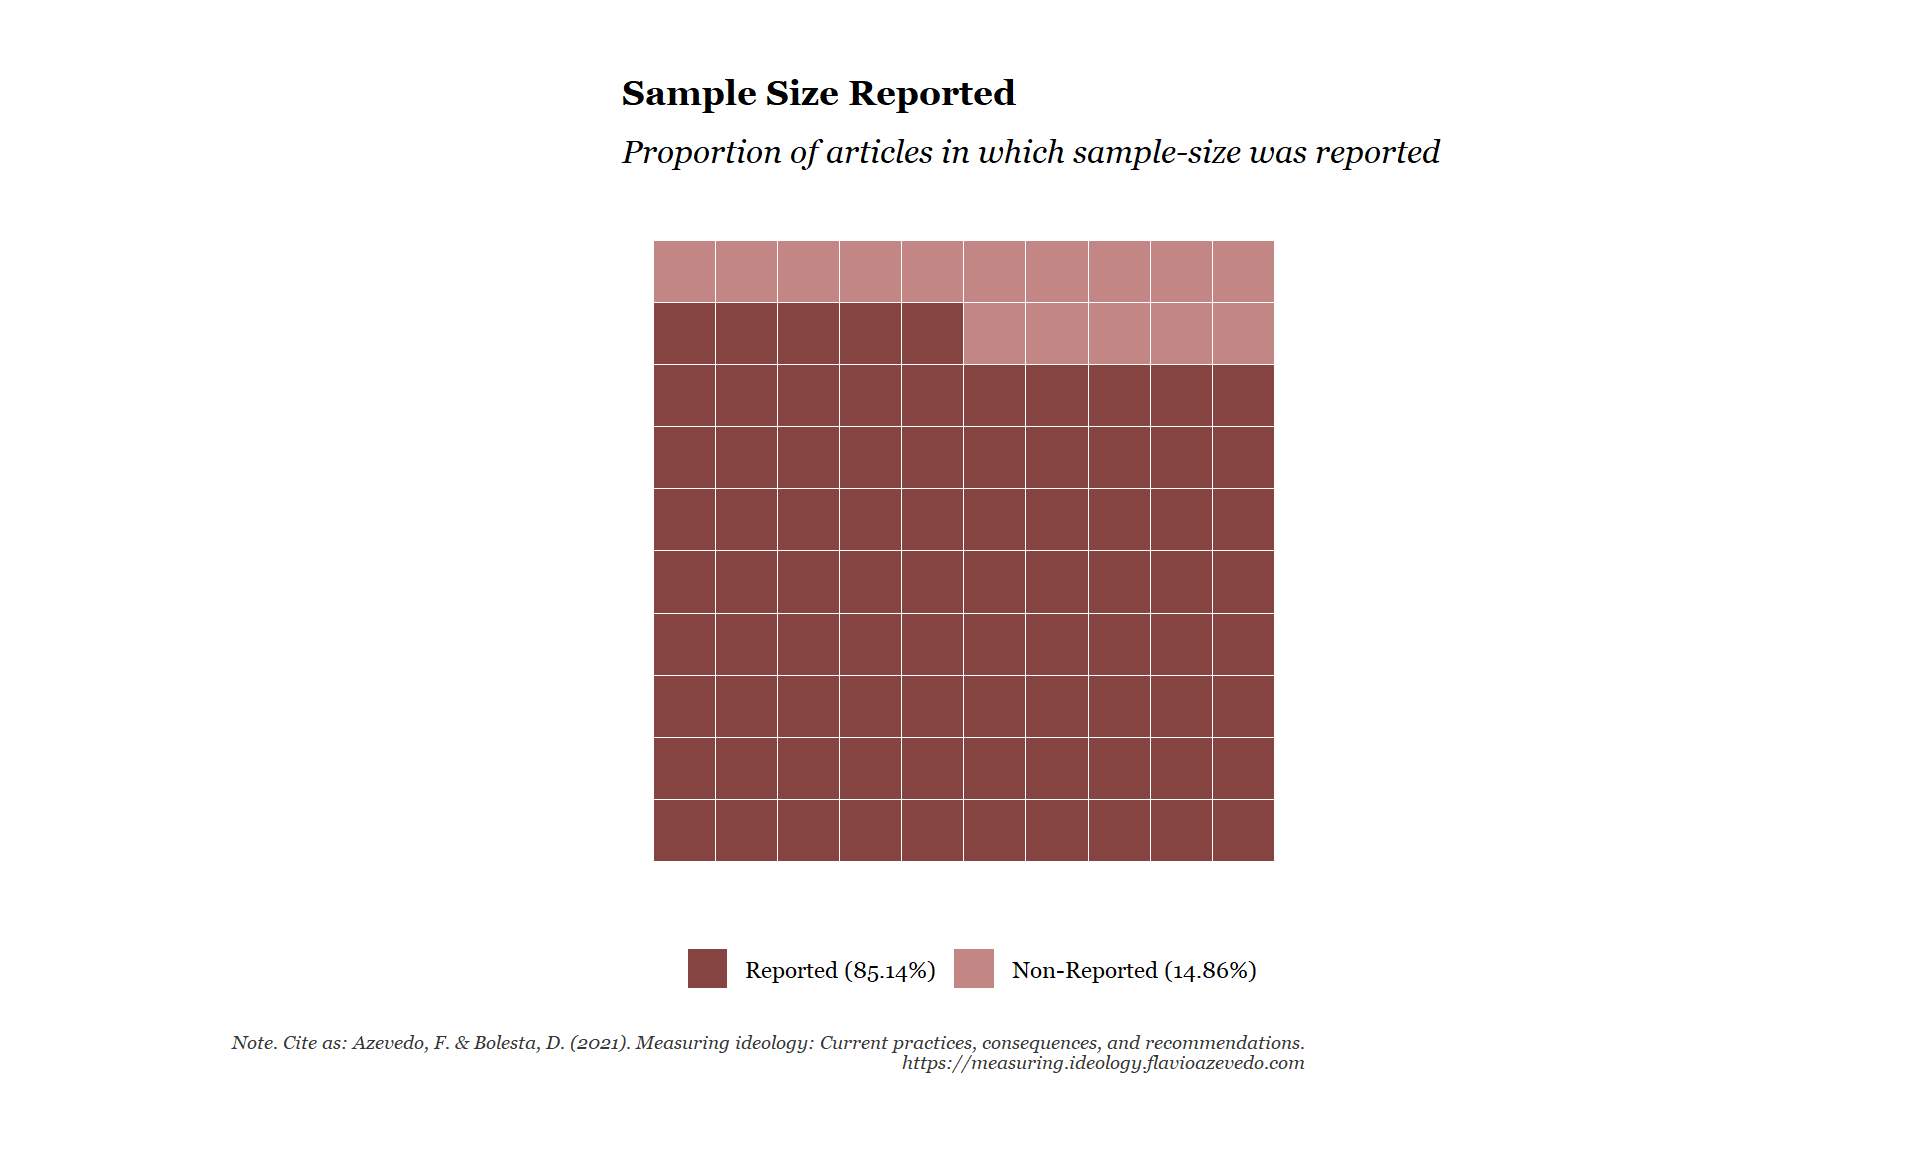
Proportion Reported
## <theme> List of 1
##  $ legend.text: <ggplot2::element_text>
##   ..@ family       : NULL
##   ..@ face         : NULL
##   ..@ italic       : chr NA
##   ..@ fontweight   : num NA
##   ..@ fontwidth    : num NA
##   ..@ colour       : NULL
##   ..@ size         : num 10
##   ..@ hjust        : NULL
##   ..@ vjust        : NULL
##   ..@ angle        : NULL
##   ..@ lineheight   : NULL
##   ..@ margin       : NULL
##   ..@ debug        : NULL
##   ..@ inherit.blank: logi FALSE
##  @ complete: logi FALSE
##  @ validate: logi TRUE
Broken-down by Discipline
Descriptives
Sample Composition
Summary
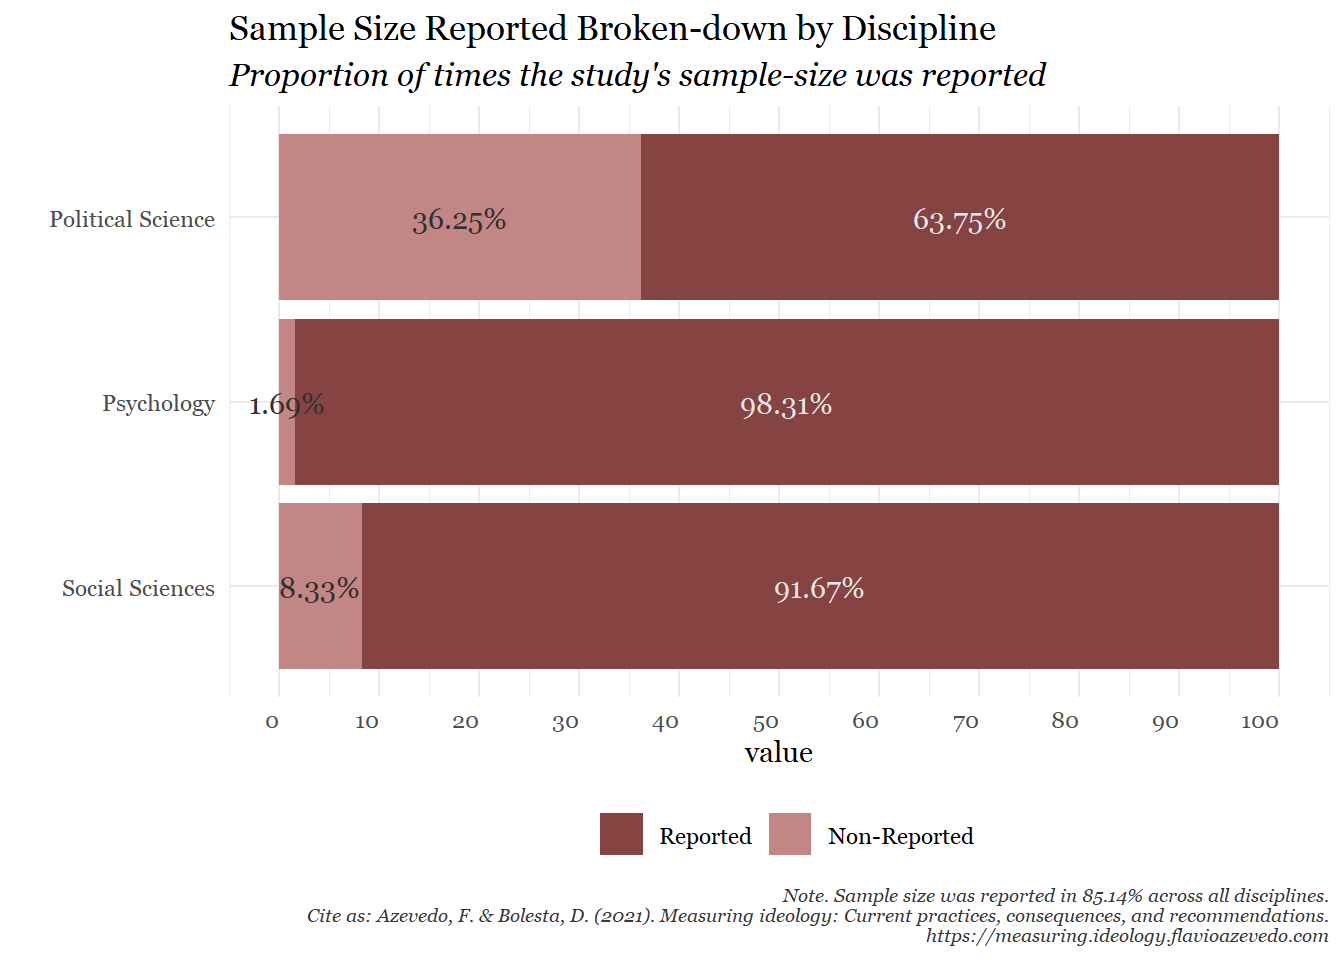
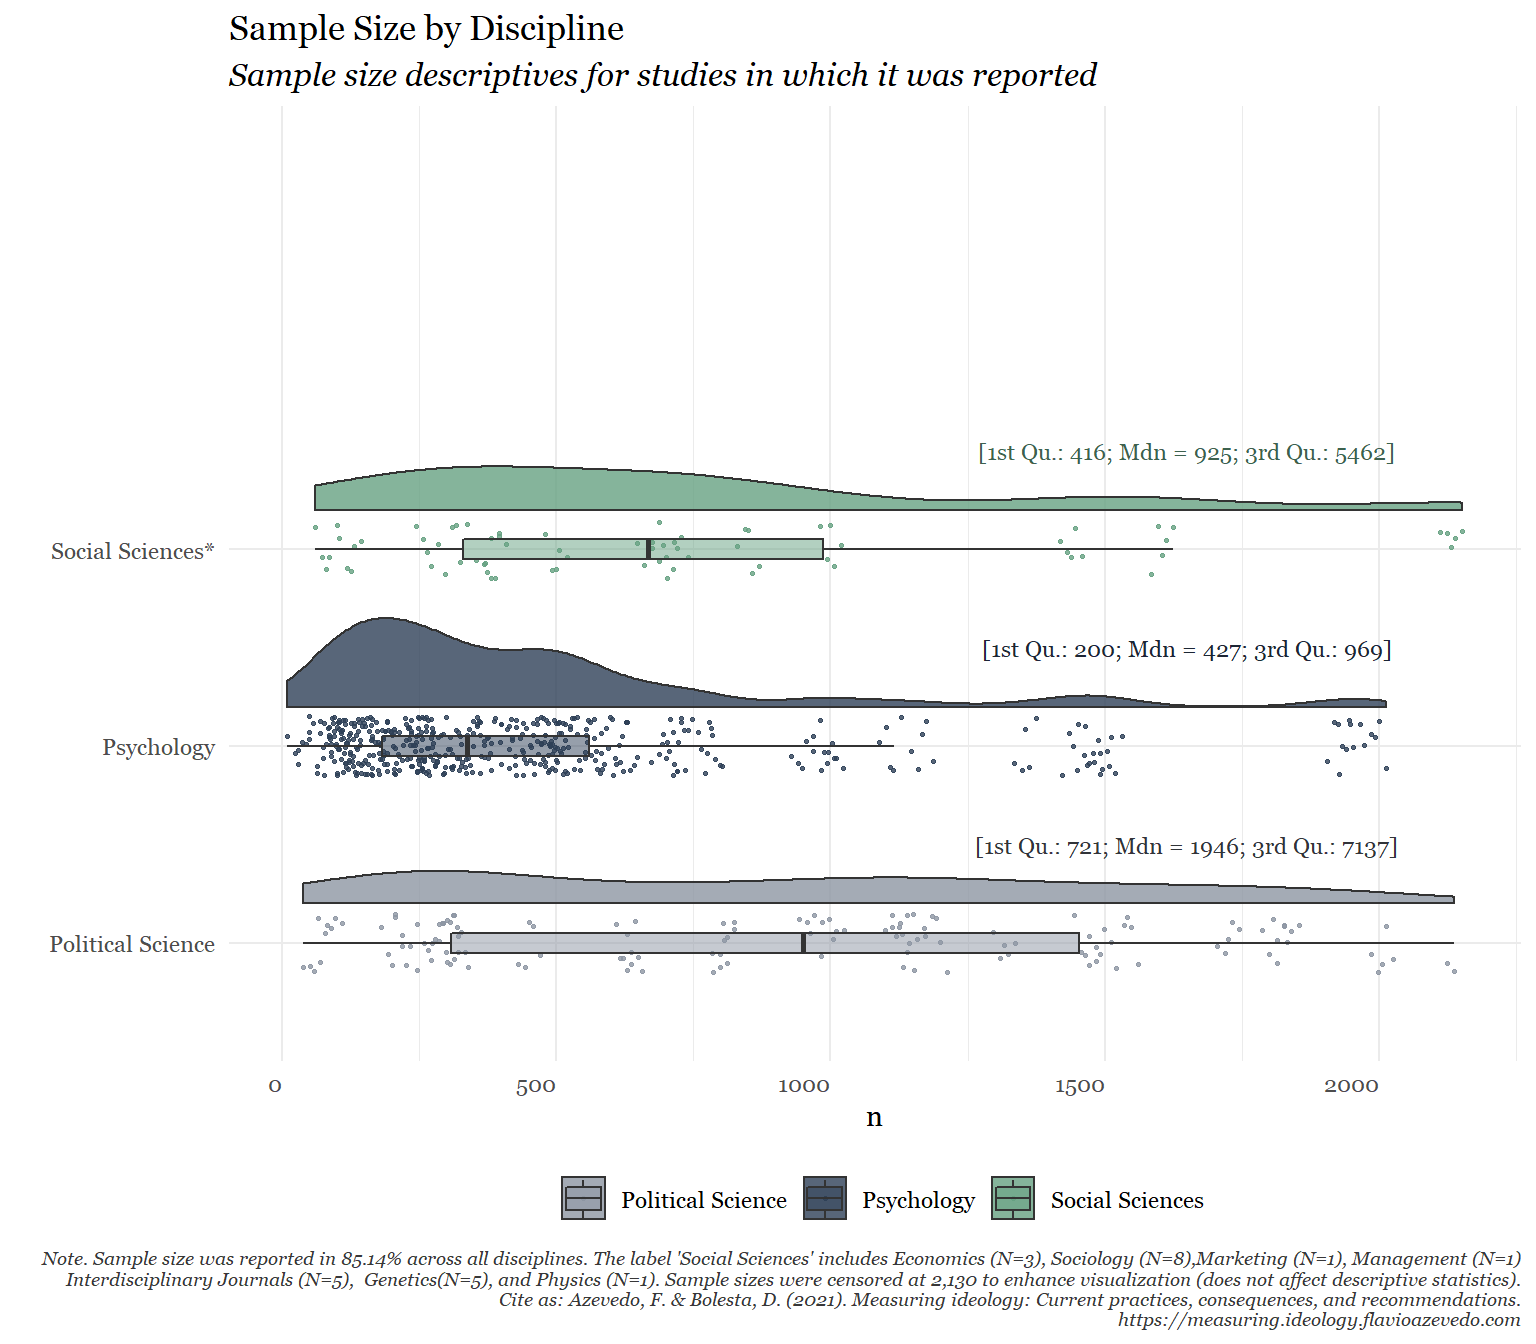
Sample size was reported in 85.14% of all cases (98.31% in Psychology, 63.75% in Political Science, and 91.67% in Social Sciences).
Across all disciplines, median sample size was 610 (SD = 66276.18, range: [30, 801725] subjects).
In Psychology, Mdn = 427 (SD = 11819.29, range: 30, 103684] subjects.
In Political Science, Mdn = 1807 (SD = 124670.78, range: [59, 801725] subjects.
In Social Sciences, Mdn = 925 (SD = 7884.89, range: 80, 35862] subjects.
Sample sizes reported in Political Science (and in Social Sciences) were significantly larger than sample sizes reported in Psychology.
Across all disciplines, samples consisted mostly of adults (56.76%) and students (25.68%).
- In Psychology, samples were almost equally made up of adults (39.83%) and students (38.14%).
- In Political Science mostly adult samples (82.5%) and almost no student samples (6.25%) were coded.
- In Social Sciences mostly adult samples (54.17%) and almost no student samples (29.17%) were coded.
In Political Science, 65.79% of the data was taken from publicly available surveys such as ANES, WVS or GSS, while it was only 3.39% in Psychology.
Sample Specifics
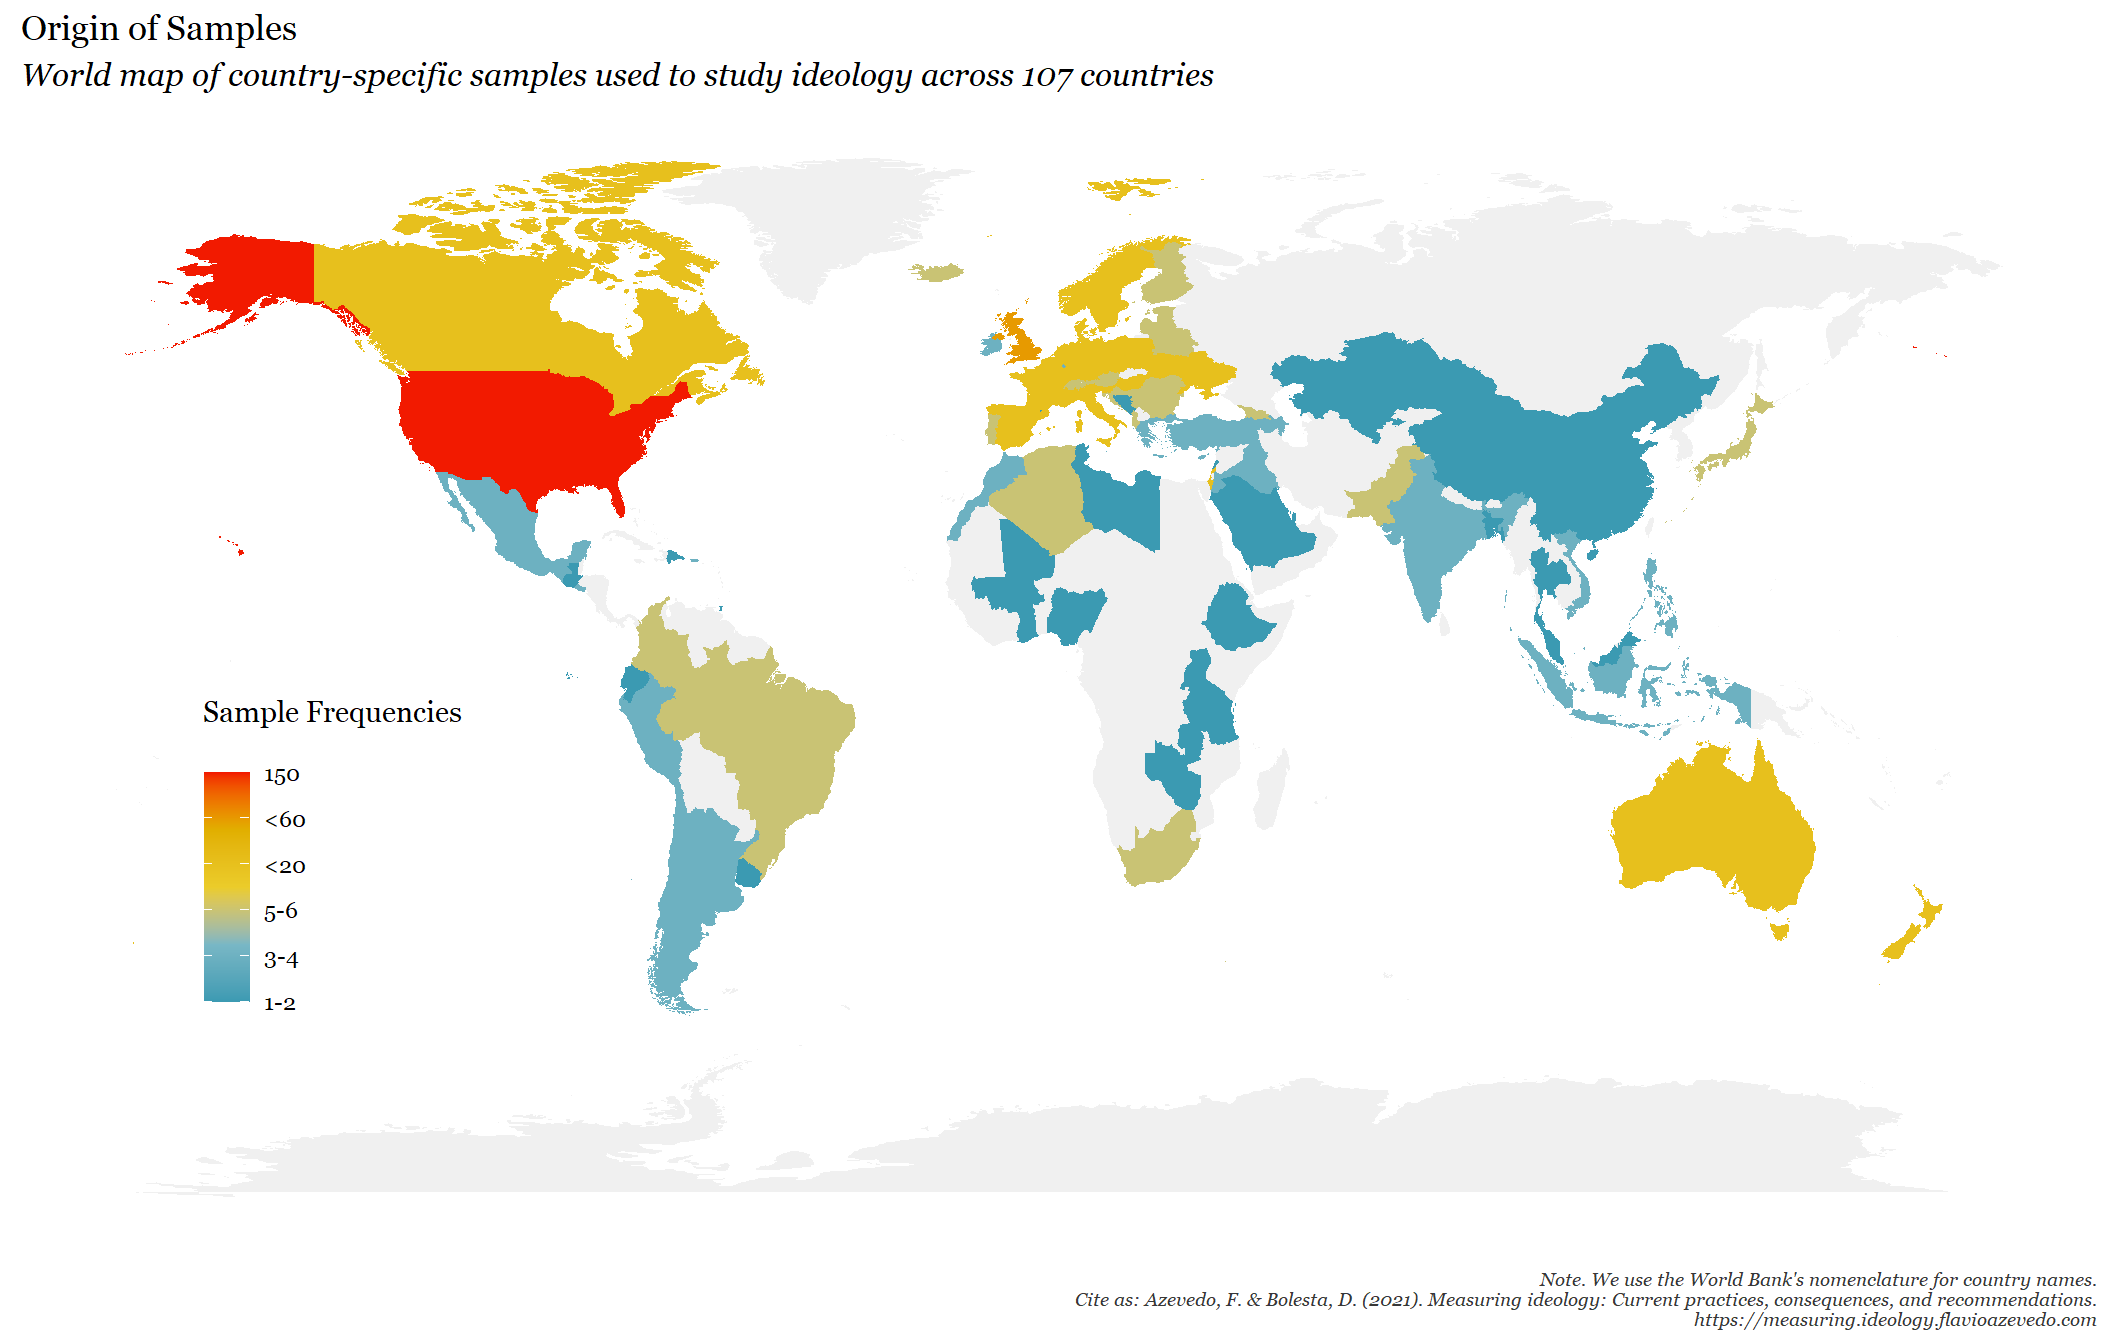
World Map
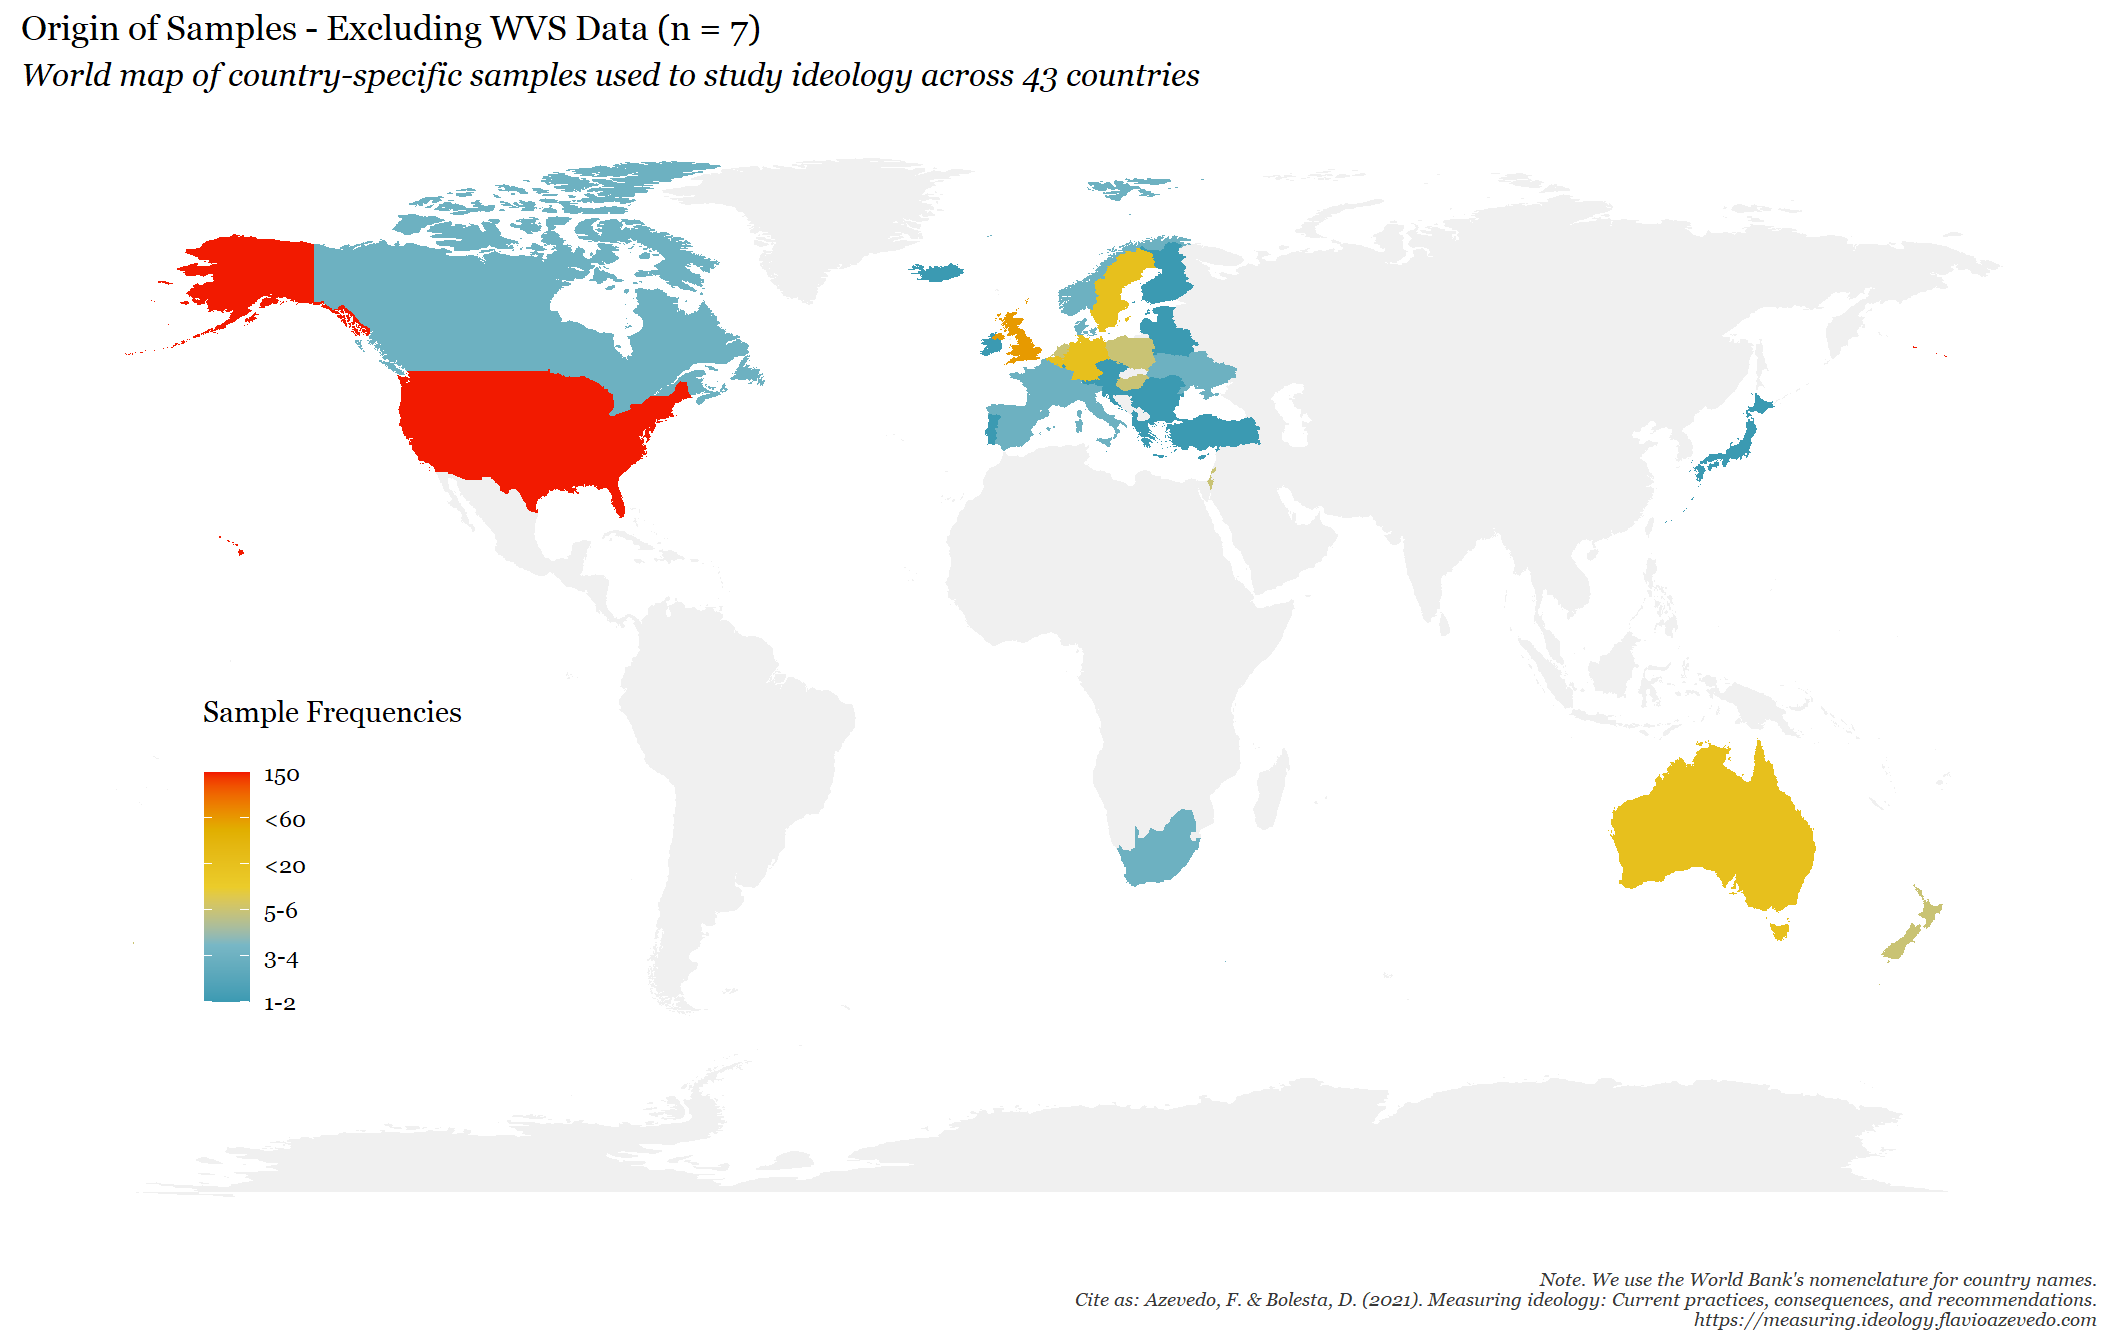
World Map - excl. WVS studies
National Representation
Ranking
| Country | Frequency | Rank | Percentage |
|---|---|---|---|
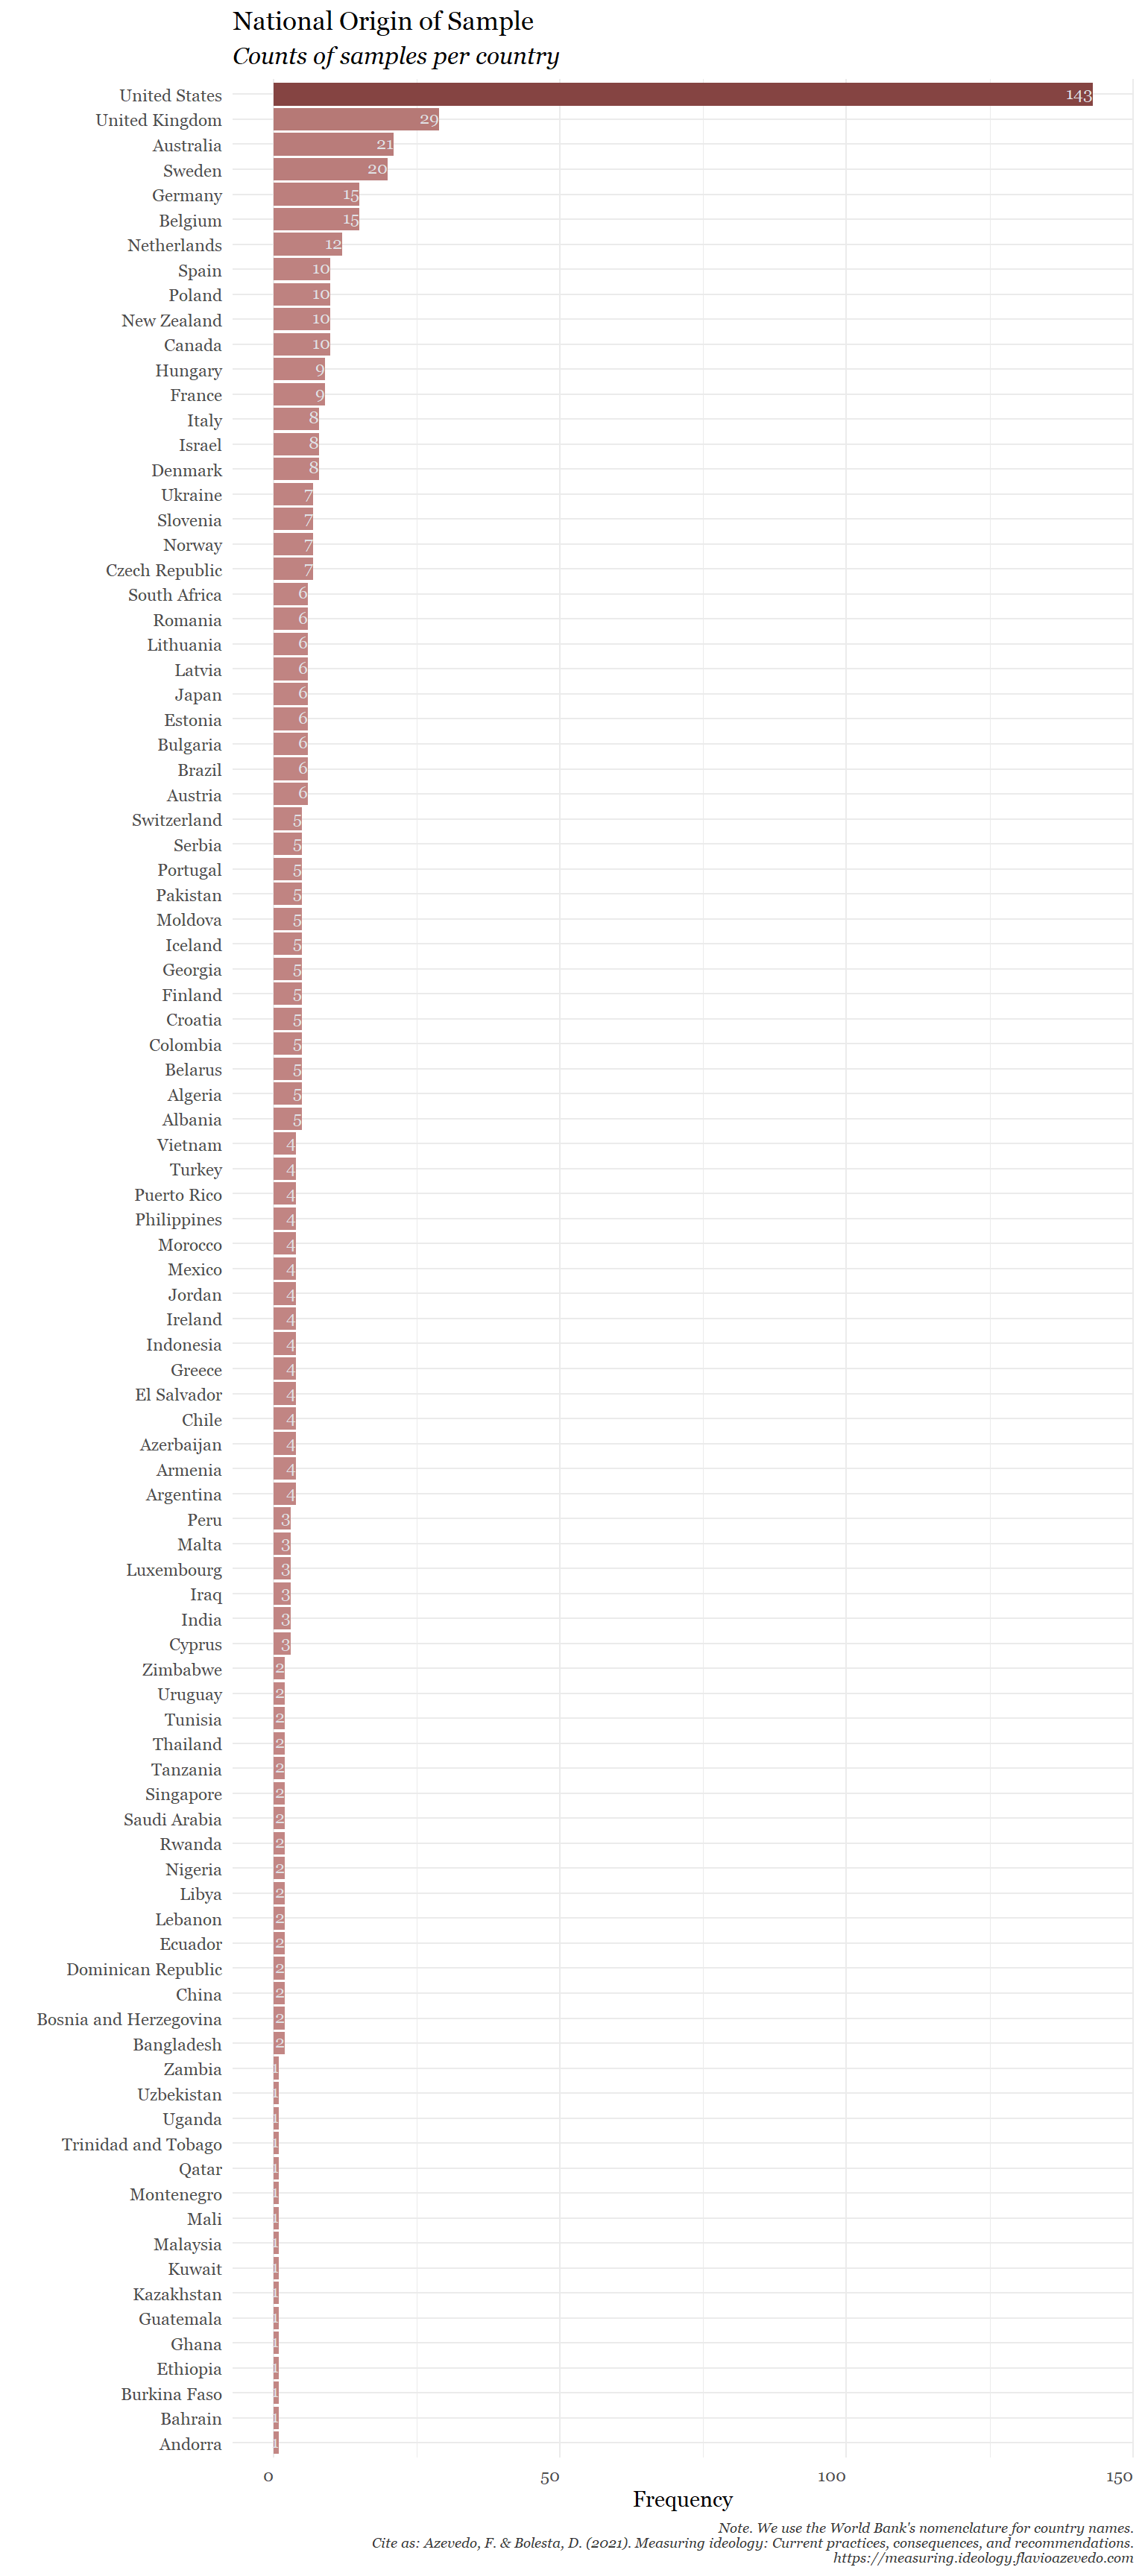
| United States | 143 | 1 | 23.44 |
| United Kingdom | 29 | 2 | 4.75 |
| Australia | 21 | 3 | 3.44 |
| Sweden | 20 | 4 | 3.28 |
| Belgium | 15 | 5 | 2.46 |
| Germany | 15 | 5 | 2.46 |
| Netherlands | 12 | 6 | 1.97 |
| Canada | 10 | 7 | 1.64 |
| Spain | 10 | 7 | 1.64 |
| New Zealand | 10 | 7 | 1.64 |
| Poland | 10 | 7 | 1.64 |
| France | 9 | 8 | 1.48 |
| Hungary | 9 | 8 | 1.48 |
| Denmark | 8 | 9 | 1.31 |
| Israel | 8 | 9 | 1.31 |
| Italy | 8 | 9 | 1.31 |
| Czech Republic | 7 | 10 | 1.15 |
| Norway | 7 | 10 | 1.15 |
| Slovenia | 7 | 10 | 1.15 |
| Ukraine | 7 | 10 | 1.15 |
Indicators of Replicability
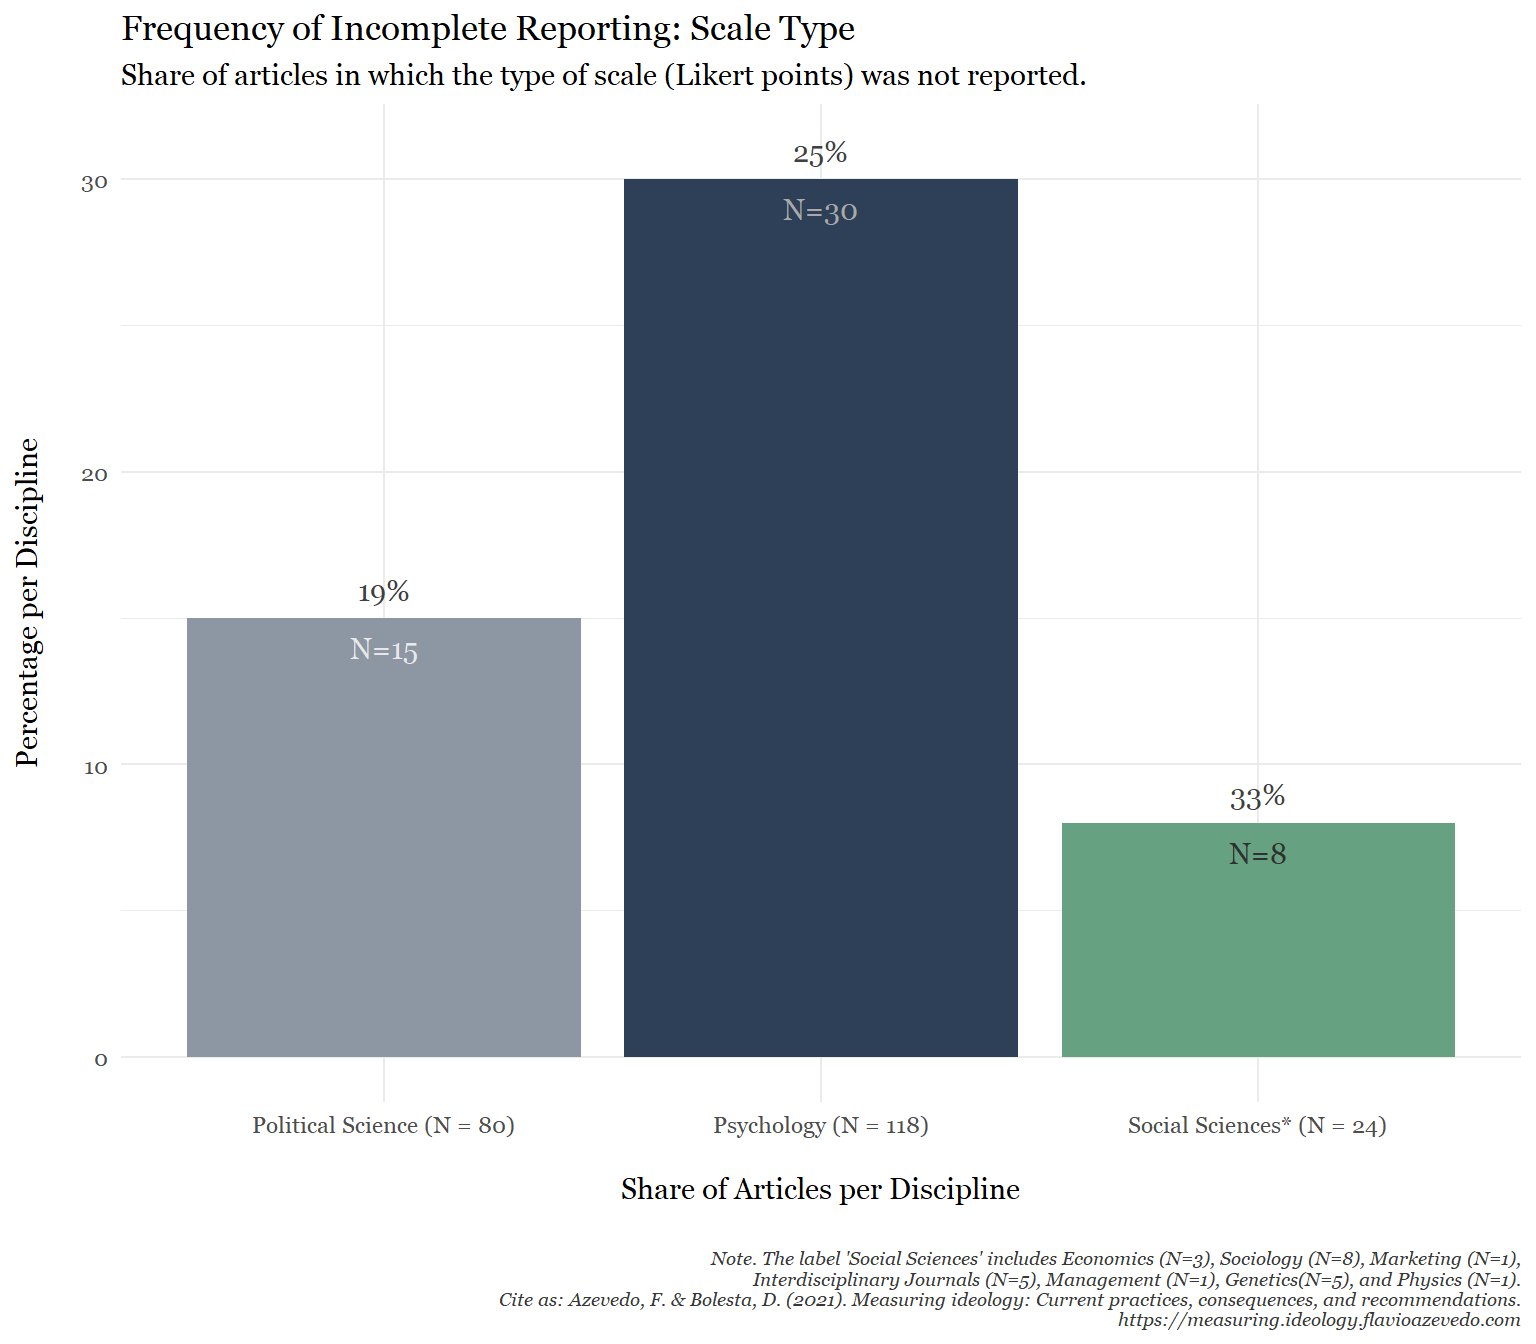
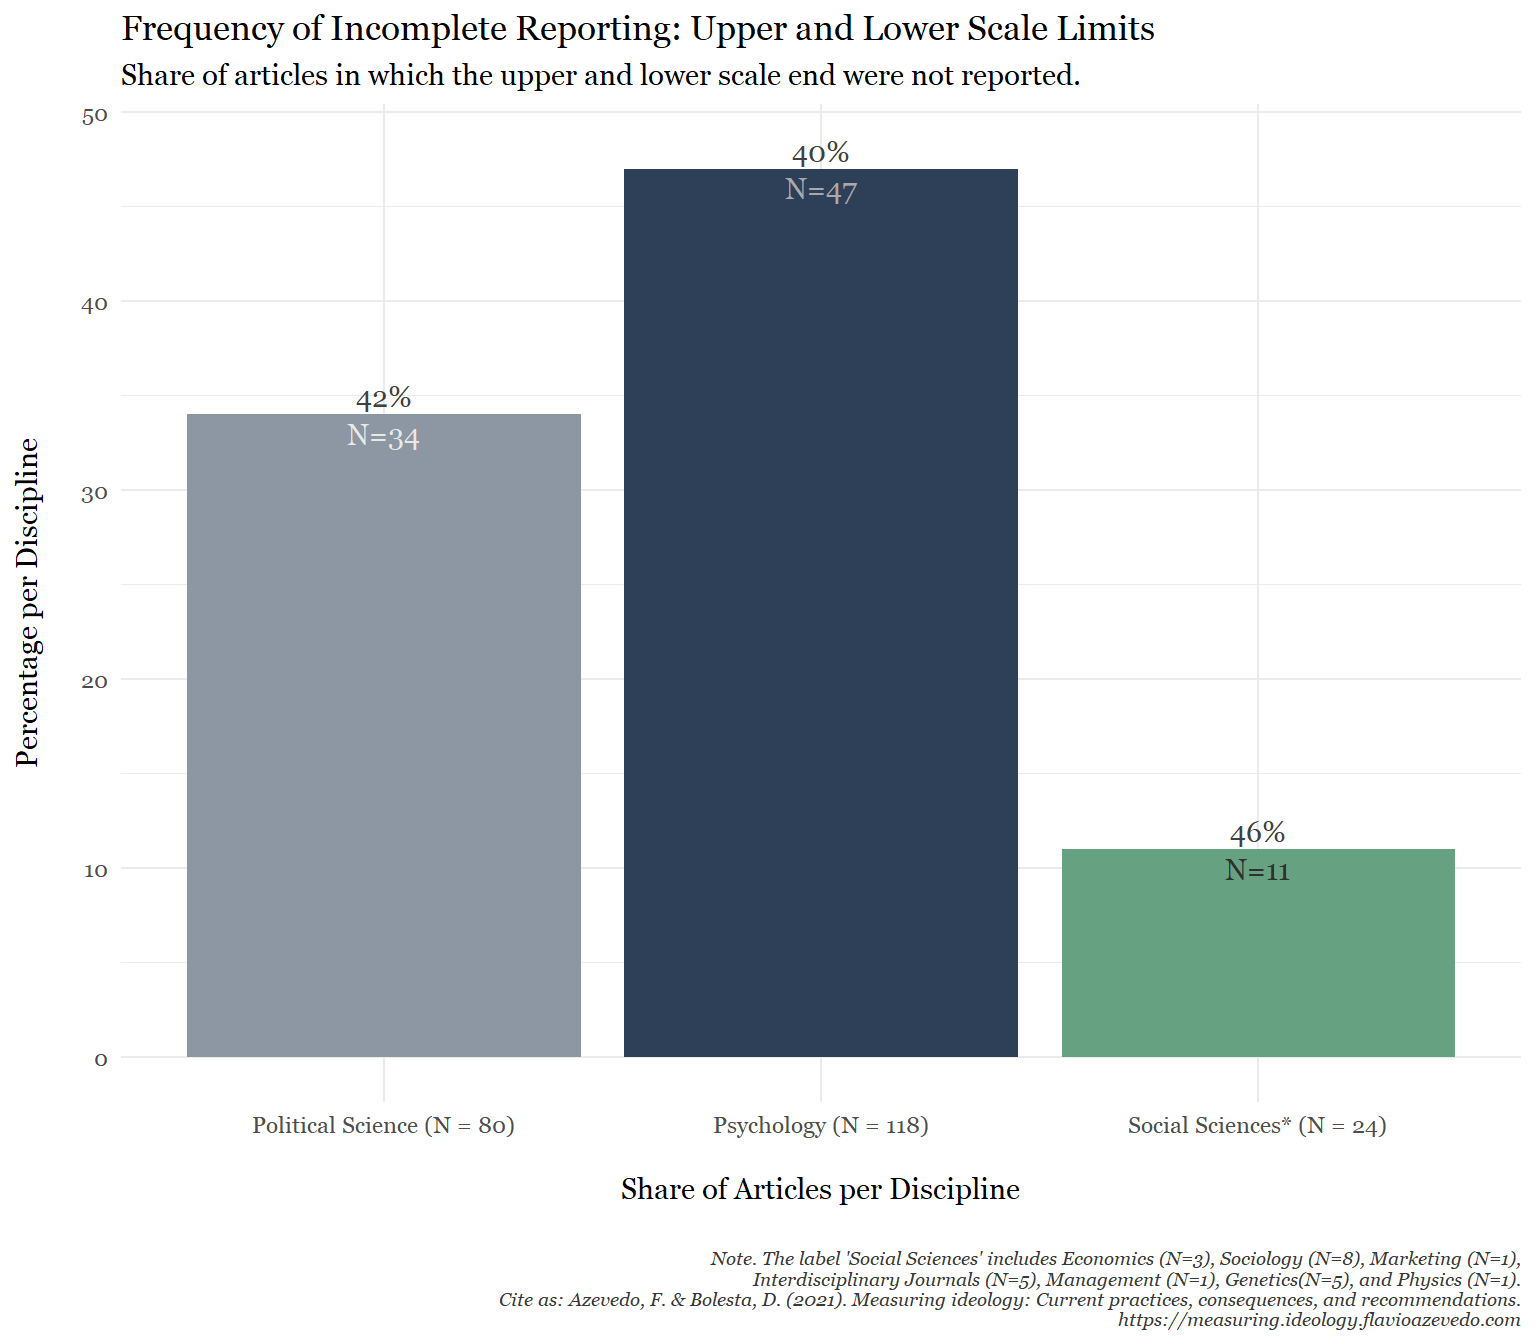
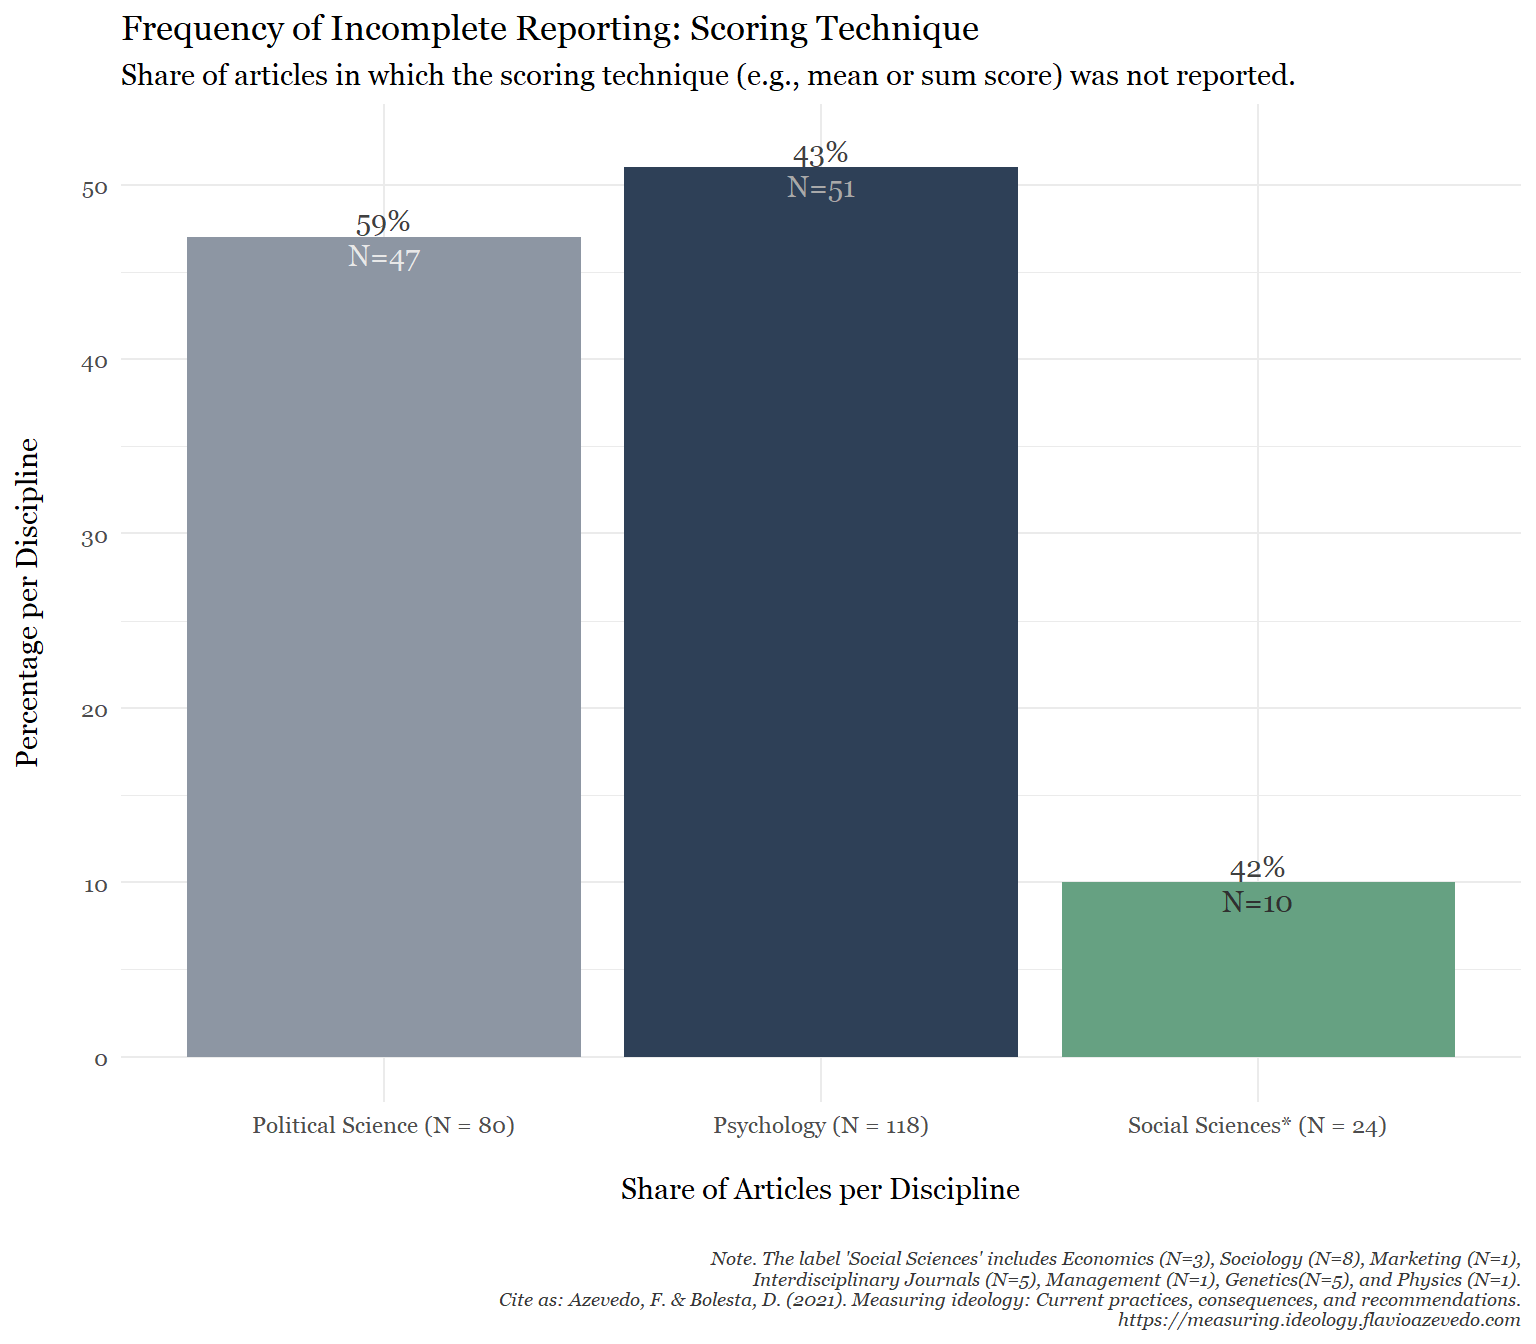
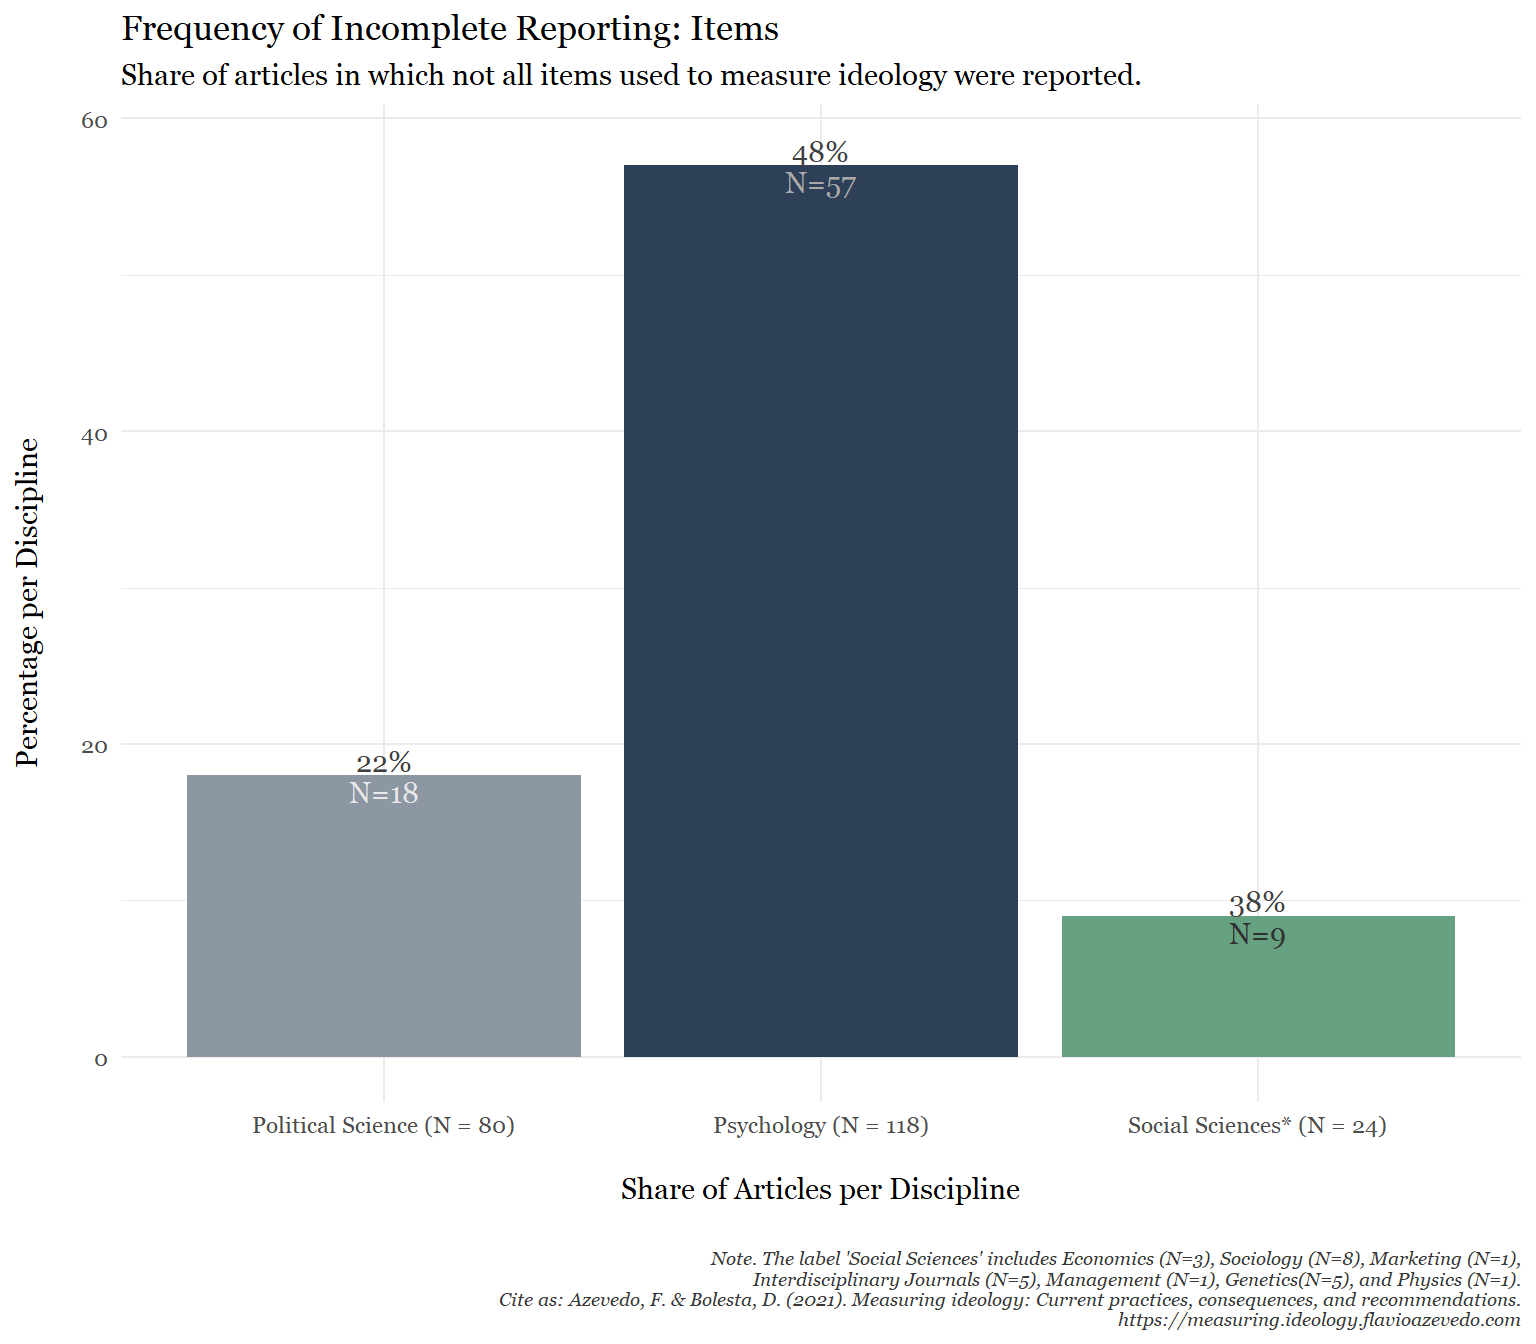
We defined a few indicators of quality or replicability of scales. These are incomplete reporting or non-reporting of a variety of important evidence for reproducibility and of quality of the instrument (to justify the use and appropriateness of the instrument) such as response coding (Likert points), transformations (approval vs non-approval), scoring method (sum, means), the disclosure of items themselves or number of items, and the administrative procedure.
Scale Type
Upper and Lower Scale Limits
Scoring Technique
Item Wording
Item Count
Indicators of Heterogeneity
We decided a priori what would be indicators of heterogeneity. Those are the presence of many articles with unique, non-validated, and on-the-fly measures, as well as its polar opposite, a low frequency of used ideological instruments that underwent validation. If the same measures were used, were they used with consistency or lots of variability (e.g., different number of items, scoring methods, with or without various transformations, etc.) thereby modifying it so it is no longer obvious these would keep the same known validated psychometric properties?
Overview
Novel Scales
Validated Scales
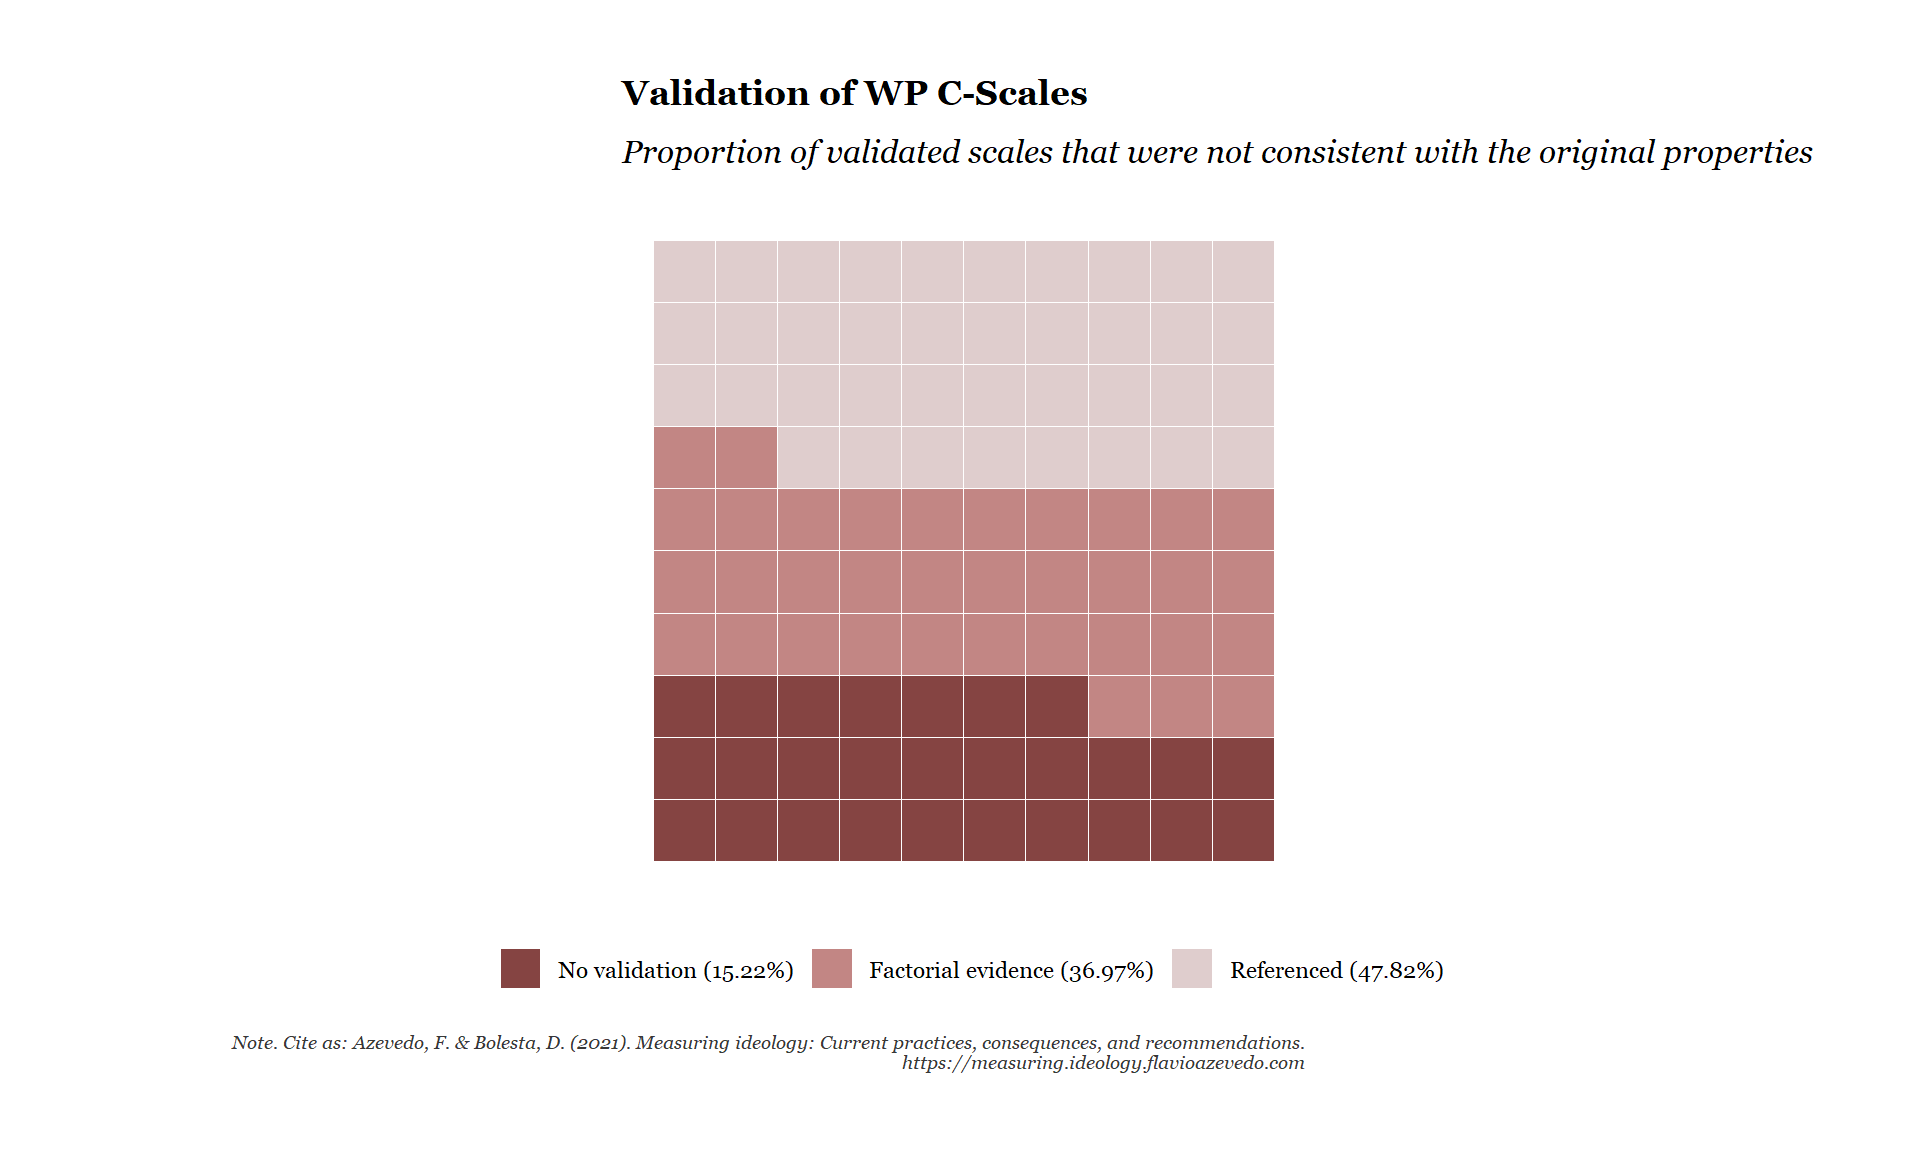
Case Study: Wilson-Patterson C-Scale
The original scale (Wilson & Patterson, 1968) presented 50 items, half of them assumed to be agreed to by participants high in conservatism. Each agreement (Yes) with a conservative statement and disagreement (No) with a non-conservative item was assigned a value of 2. A value of 0 was assigned for answers of the opposite pattern (i.e. disagreement with conservative statements and agreement with non-conservative statements). If uncertain (?) a value of 1 was given. The authors aggregated all values (sum score) resulting in a possible range of scores from 0 to 100.
Overview
Heterogeneity
Validity
Content Analysis
Meta-analytical approaches in psychology build on the tacit yet untested assumption that the various measures of ideology can be used interchangeably. In the following section we present the results of an inductive and deductive content analysis where we evaluated 10 ideological scales regarding their content.
Methods
In order to estimate the extent to which operational measures of political ideology overlap regarding item contents, we examined the most frequently coded scales from Study 1: the 50-item Conservatism Scale (Wilson & Patterson, 1968), and the 24-item Middendorp Cultural and Economic Conservatism scale (De Witte, 1990). Eight mores cales were selected based on their relevance in terms of citation count, and inclusion in recent publications: a 7-item Core Issues scale (Feldman & Johnston, 2014), a 12-item Social and Economic Conservatism scale (Everett, 2013), a 12-item Social Conservatism (Henningham, 1996) and a 20-item Economic Conservatism scale (Henningham, 1997), a 10-item scale from Inbar et al. (2009), a 12-item scale by Zell and Bernstein (2014), a 31-item scale from Layman and Carsey (2002), and the 36-item S6 Conservatism scale(Sidanius, 1987). The total item count of the included scales was 214.
Content Analysis
Following Mayring (2014), we analyzed the item corpus (N= 214) in a mixed approach combining structuring (deductive) and summarizing (inductive) category formation procedures.
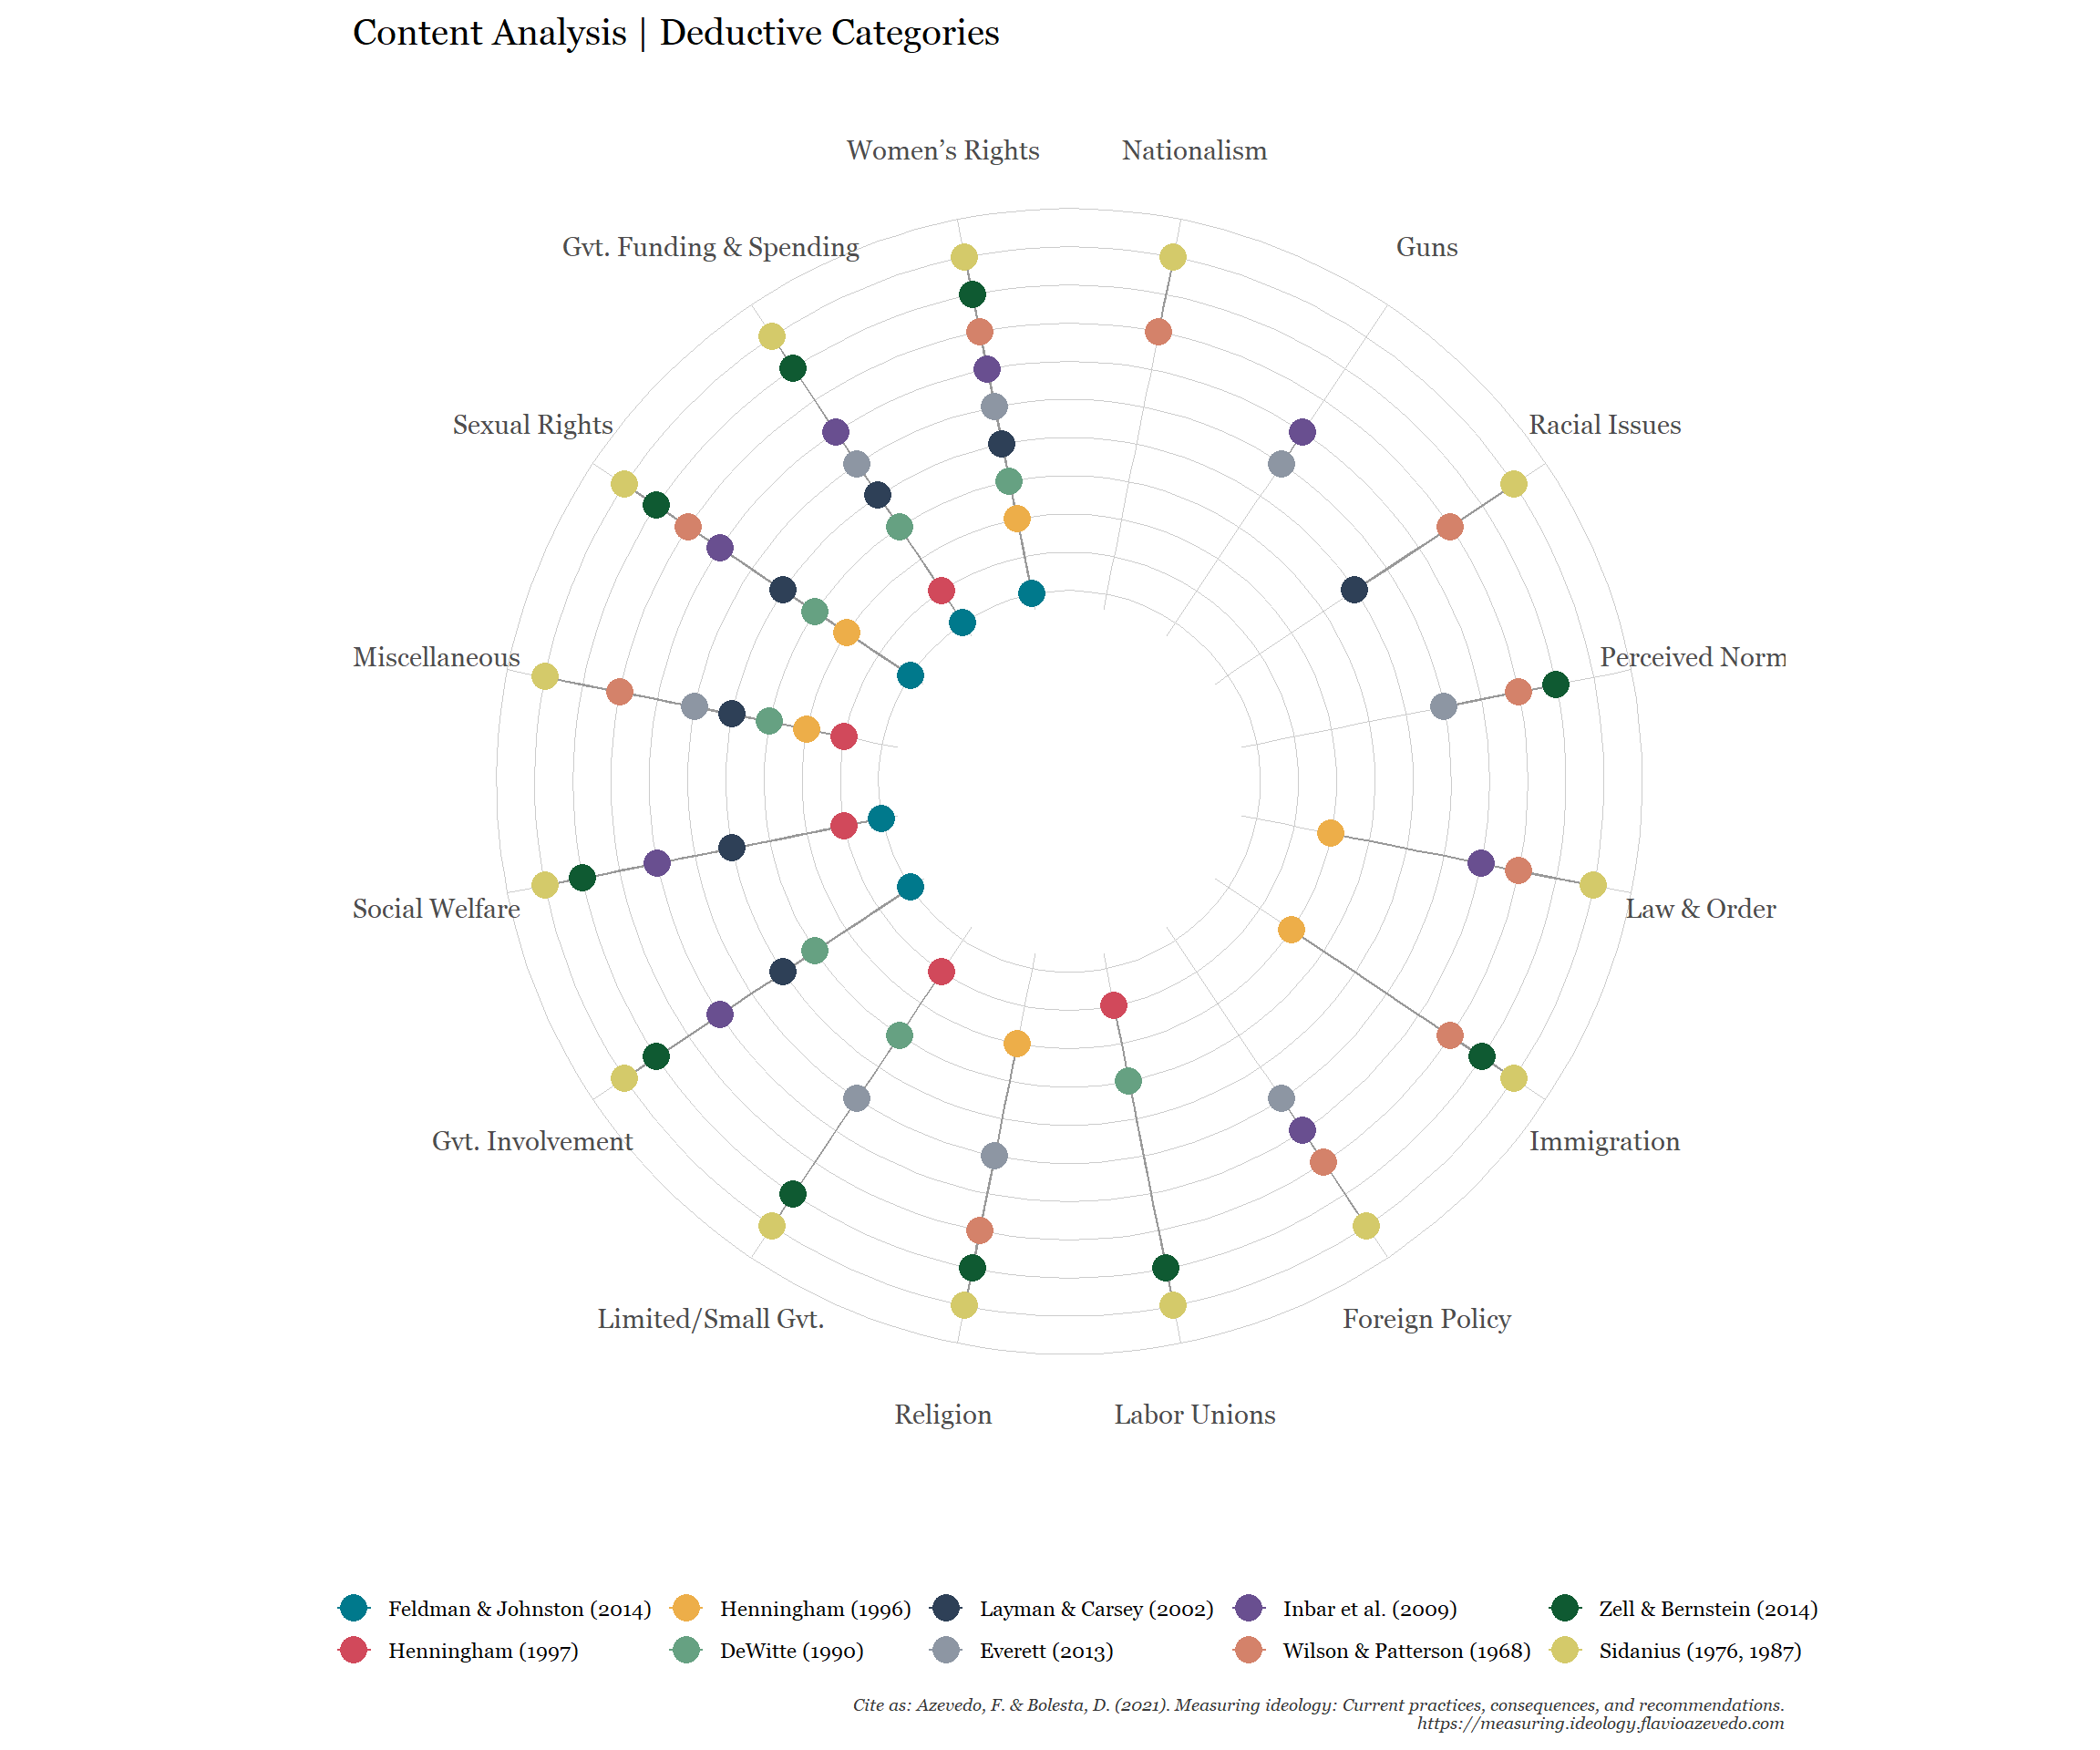
Deductive Category Formation
The objective of deductive category formation is to extract a certain structure from the data. Other than inductive categories, deductive categories are defined a priori, need to be derived from theoretical considerations, and remain unaltered throughout the analysis (Mayring, 2014, p. 95 ff.). A total of 16 categories were extracted: Foreign Policy, Government Funding &Spending, Government Involvement, Guns, Immigration, Labor Unions, Law & Order,Limited/Small Government, Nationalism, Perceived Norms, Racial Issues, Religion, SexualRights, Social Welfare, Women’s Rights, and Miscellaneous for any item that did not fit any of the deductive categories.
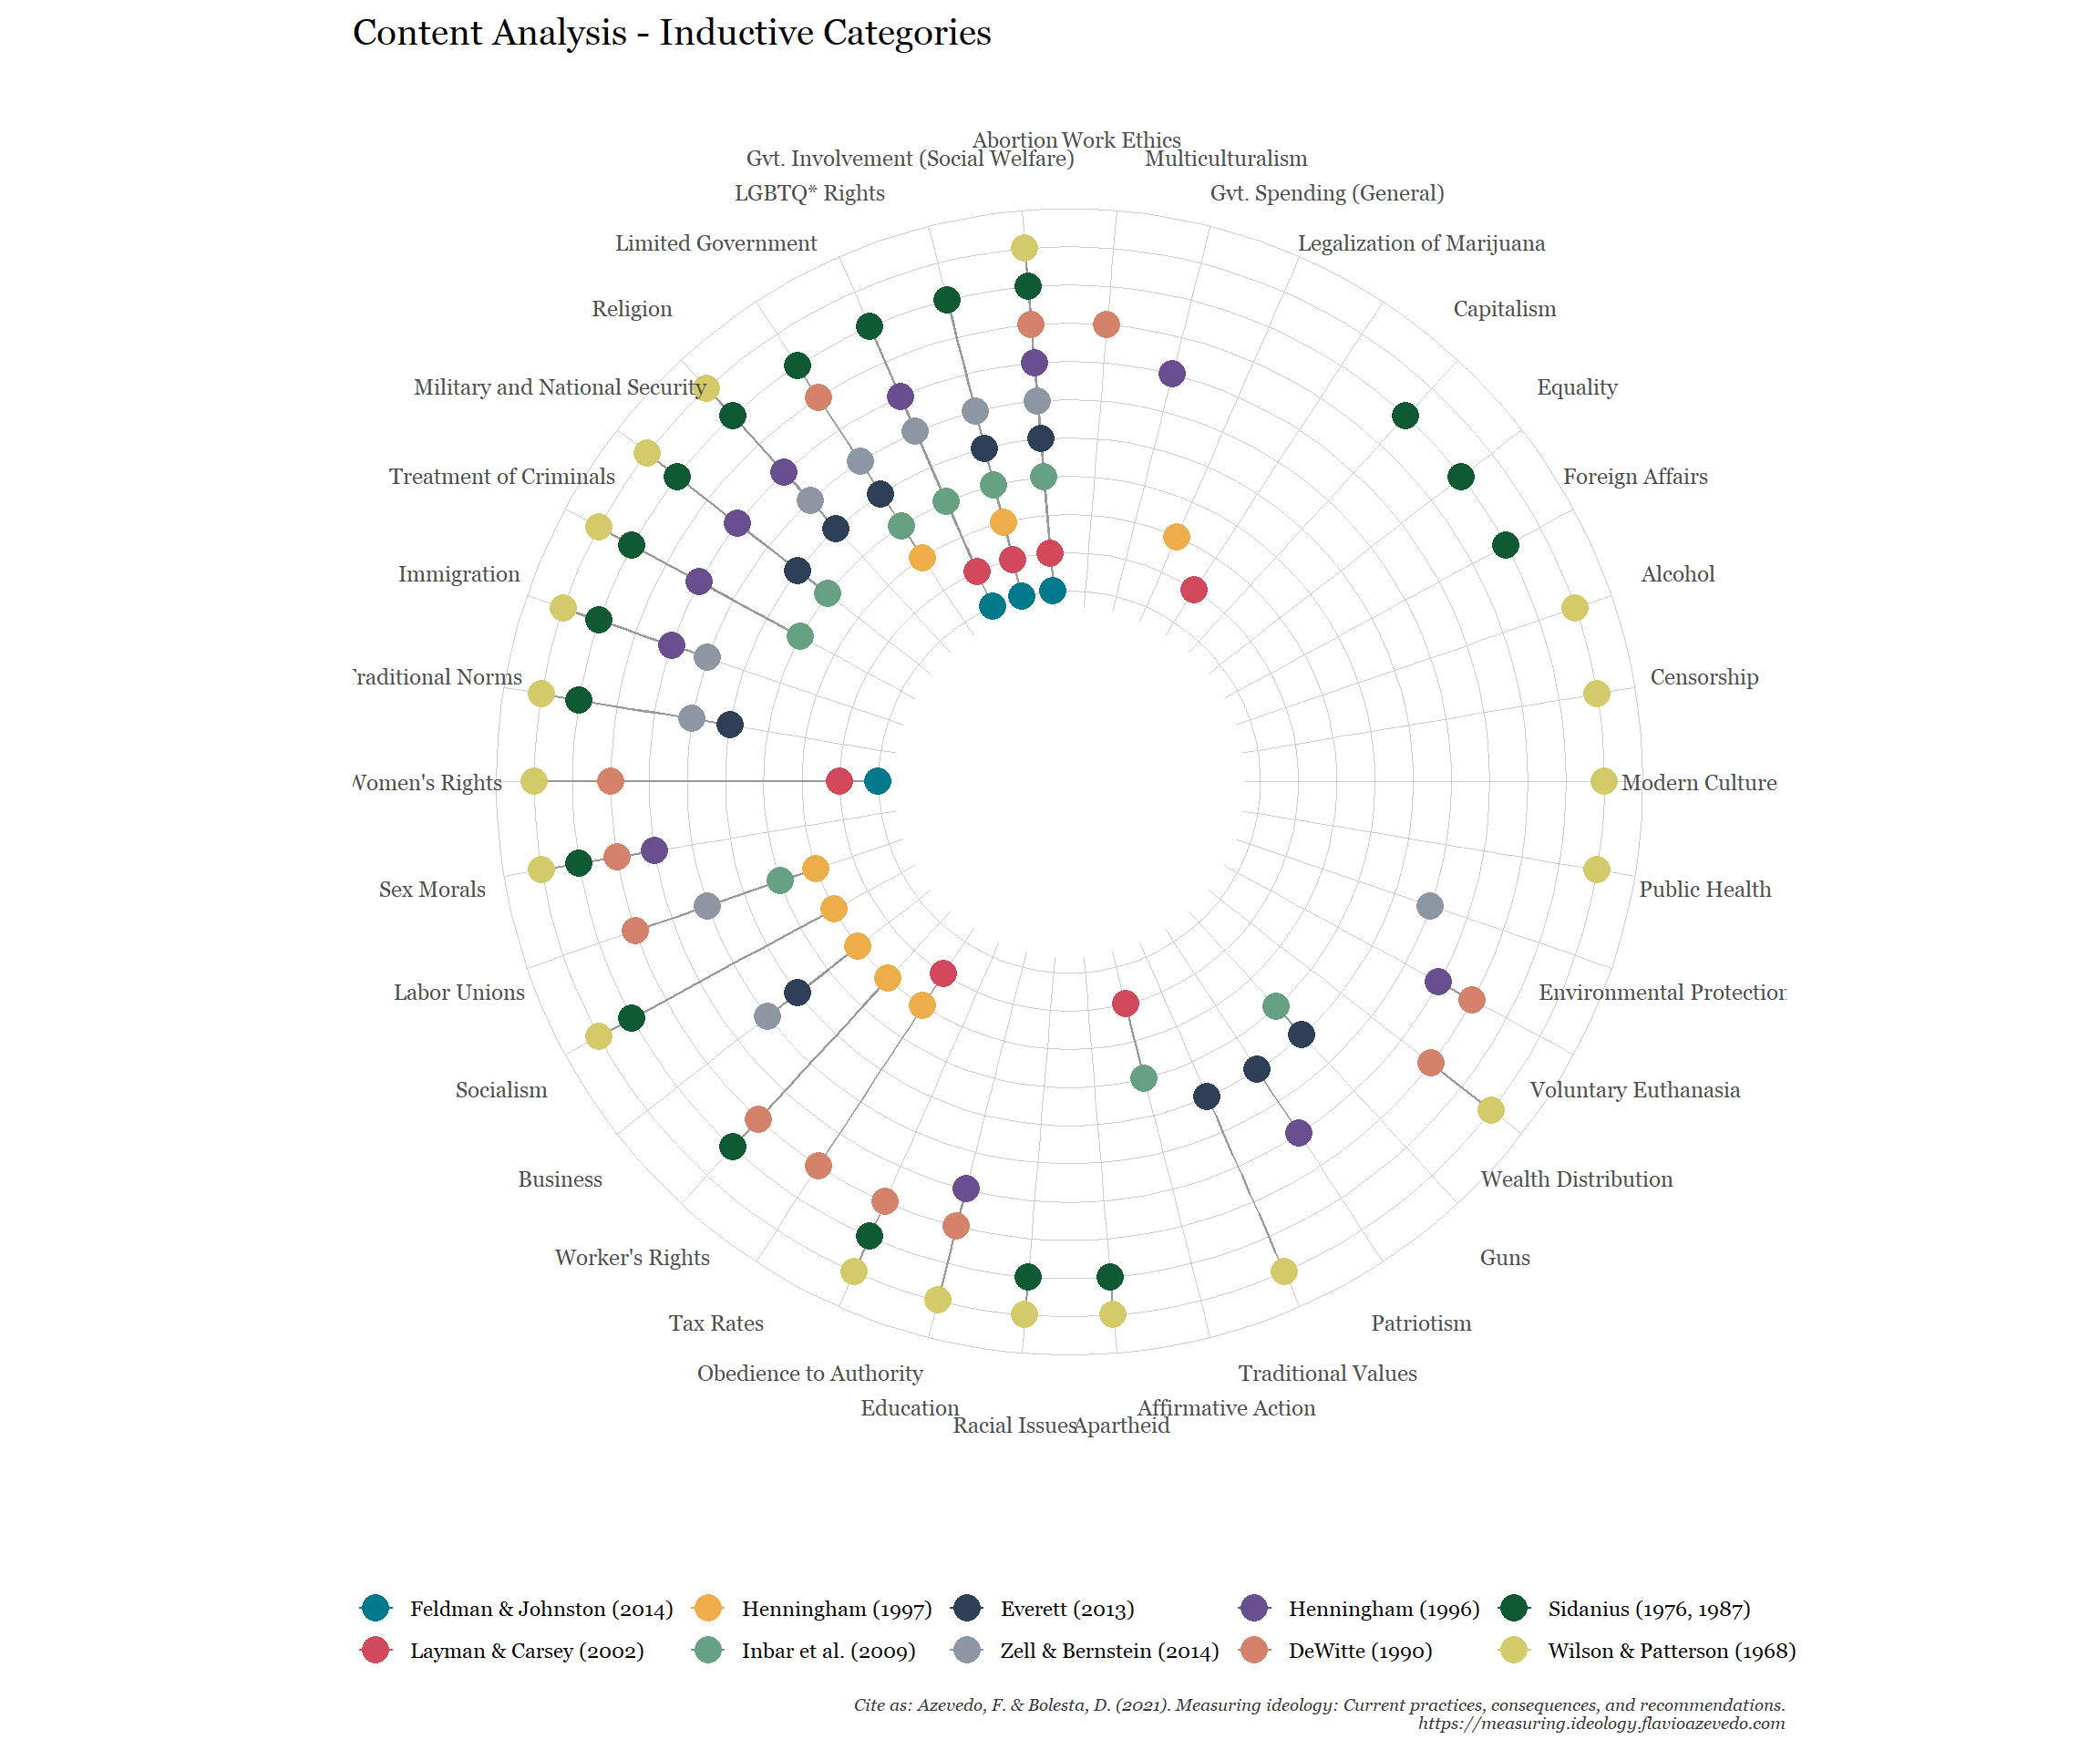
Inductive Category Formation
Inductive category formation or open coding (Strauss, 1987; Strauss & Corbin, 1990) is a procedure used to reduce or summarize qualitative data “in order to create through abstraction a comprehensive overview of the base material which is nevertheless still an image of it” (Mayring, 2014, p. 64). In a first step, we assigned each item that consisted of a full sentence and not just a topic a sufficiently specific overarching category. For instance Homosexuals should have the same right to marriage as anyone else (item 2 from Inbar et al., 2009) was assigned the topic same-sex marriage. This resulted in a total of 123 topics. Four items were excluded because we did not find an overarching political topic given that their relevance might have decreased, namely life insurance, (item 10 from Henningham, 1997), self-denial, horoscopes, and straitjackets (items 9, 11, 43 from Wilson &Patterson, 1968). Secondly, we compared topics across scales and aggregated topics that were similar in content. For instance same-sex marriage and adoption rights for homosexual couples were both coded as LGBTQ rights. This iterative procedure was repeated twice and resulted in a total of 39 overarching categories.
Statistical Analysis
We used the Jaccard Index (Jaccard, 1901) to quantify the content overlap between each of the scales based on deductive and inductive categories, respectively. The Jaccard Index estimates “the relative size of the intersection between the two sets when comparedto their union” (Leydesdorff, 2008, p. 79), that is the ratio of s, the number of categories two scales share, to the unique categories (u1, u2): s / u1 + u2 + s, resulting in a similarity coefficient ranging from 0 (no overlap) to 1 (complete overlap).
Interpretation
Similar to Fried (2017), the Jaccard similarity coefficient will be interpreted according to correlation coefficient guidelines that suggest a very weak relationship for .00–.19, a weak relationship for .20–.39,a moderate relationship for .40–.59, a strong relationship for .60–.79, and a very strong relationship for .80–1.0.
Results
Deductive Categories
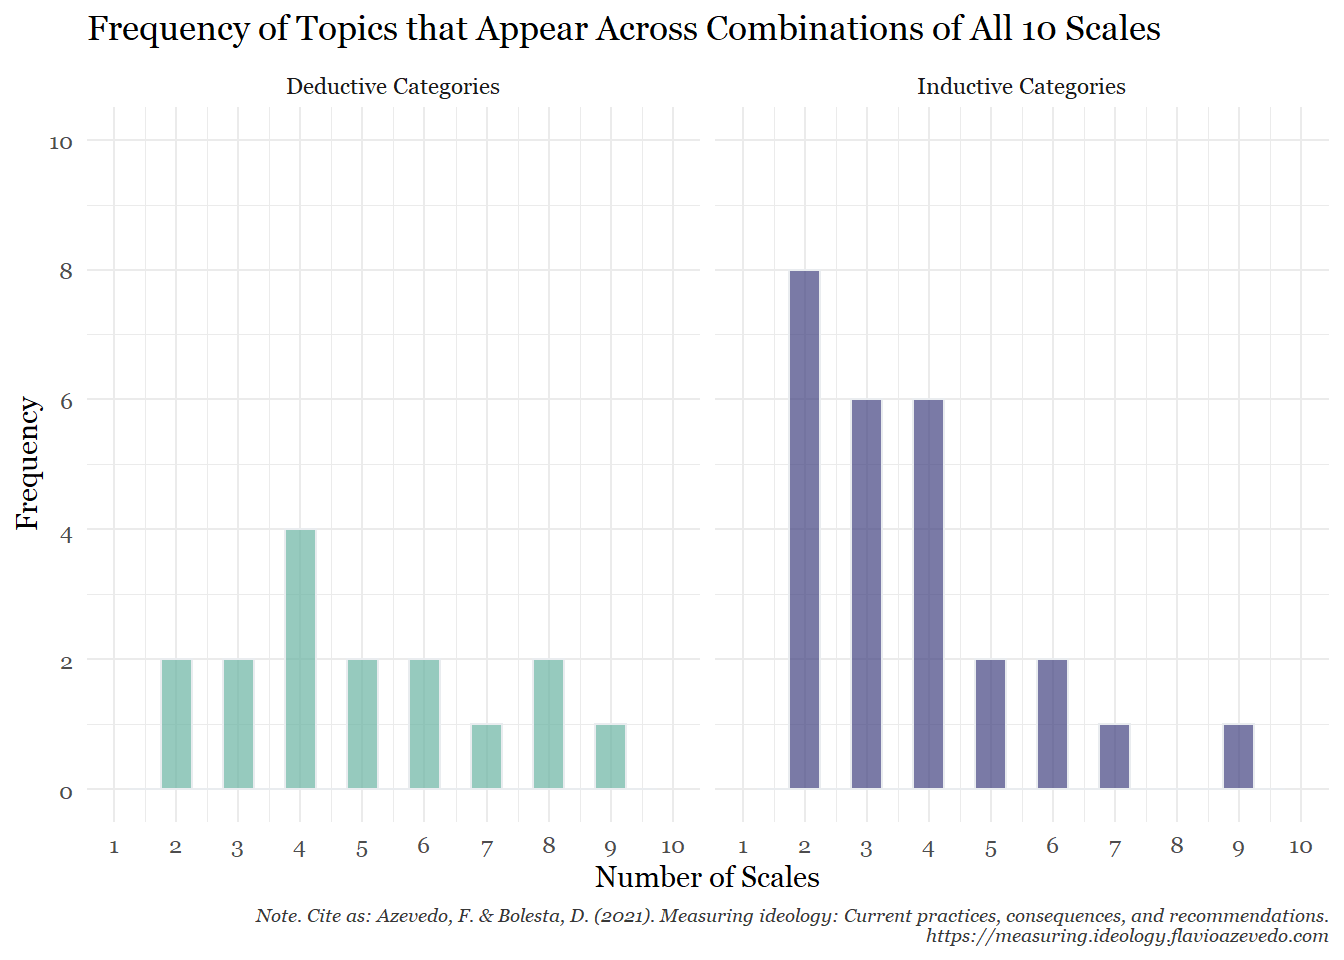
On average, an ideological topic was present in 5 out of the 10 ideological scales (mode = 4, median = 4.5). Of the 16 deductive topics, 2 (12.5%, Nationalism, Guns) appeared in 2 scales only and no scale featured all 10 topics. One topic (6.25%), Women’s Rights, was present in all scales except Henningham (1997), and another 2 topics (12.5%) were present in 8 out of 10 scales: Sexual Rights, and Government Funding & Spending.
| Topic | Frequency |
|---|---|
| Nationalism | 2 |
| Guns | 2 |
| Racial Issues | 3 |
| Perceived Norms | 3 |
| Law & Order | 4 |
| Immigration | 4 |
| Foreign Policy | 4 |
| Labor Unions | 4 |
| Religion | 5 |
| Limited/Small Gvt. | 5 |
| Gvt. Involvement | 6 |
| Social Welfare | 6 |
| Miscellaneous | 7 |
| Sexual Rights | 8 |
| Gvt. Funding & Spending | 8 |
| Women’s Rights | 9 |
Content Analysis
Statistical Analysis
| DeWitte (1990) | Everett (2013) | Feldman & Johnston (2014) | Henningham (1996) | Henningham (1997) | Inbar et al. (2009) | Layman & Carsey (2002) | Sidanius (1987) | Wilson & Patterson (1968) | Zell & Bernstein (2014) | |
|---|---|---|---|---|---|---|---|---|---|---|
| DeWitte (1990) | 0.00 | 0.30 | 0.57 | 0.22 | 0.43 | 0.40 | 0.50 | 0.46 | 0.15 | 0.60 |
| Everett (2013) | 0.30 | 0.00 | 0.20 | 0.20 | 0.22 | 0.36 | 0.18 | 0.33 | 0.33 | 0.42 |
| Feldman & Johnston (2014) | 0.57 | 0.20 | 0.00 | 0.25 | 0.29 | 0.62 | 0.83 | 0.38 | 0.17 | 0.50 |
| Henningham (1996) | 0.22 | 0.20 | 0.25 | 0.00 | 0.00 | 0.30 | 0.22 | 0.38 | 0.56 | 0.36 |
| Henningham (1997) | 0.43 | 0.22 | 0.29 | 0.00 | 0.00 | 0.20 | 0.25 | 0.31 | 0.00 | 0.40 |
| Inbar et al. (2009) | 0.40 | 0.36 | 0.62 | 0.30 | 0.20 | 0.00 | 0.56 | 0.50 | 0.31 | 0.38 |
| Layman & Carsey (2002) | 0.50 | 0.18 | 0.83 | 0.22 | 0.25 | 0.56 | 0.00 | 0.46 | 0.25 | 0.45 |
| Sidanius (1987) | 0.46 | 0.33 | 0.38 | 0.38 | 0.31 | 0.50 | 0.46 | 0.00 | 0.57 | 0.64 |
| Wilson & Patterson (1968) | 0.15 | 0.33 | 0.17 | 0.56 | 0.00 | 0.31 | 0.25 | 0.57 | 0.00 | 0.36 |
| Zell & Bernstein (2014) | 0.60 | 0.42 | 0.50 | 0.36 | 0.40 | 0.38 | 0.45 | 0.64 | 0.36 | 0.00 |
Inductive Categories
On average, an ideological topic was present in 2.84 out of the
10 ideological scales (mode = 1, median = 2). 12 (30.78%) out of the 39
inductively coded topics appear only in one single scale: Work
Ethics, Multiculturalism, Government Spending (General), Legalization of
Marijuana, Capitalism, Equality, Foreign Affairs, Alcohol, Censorship,
Modern Culture, Public Health, and Environmental
Protection. Only one third (n = 13) of all ideological
topics was featured in more than three out of ten scales. The only
ideological topic that was included in all but one (Henningham, 1997)
scale was Abortion. None of the topics was featured in all ten
scales.
Content Analysis
Statistical Analysis
| DeWitte (1990) | Everett (2013) | Feldman & Johnston (2014) | Henningham (1996) | Henningham (1997) | Inbar et al. (2009) | Layman & Carsey (2002) | Sidanius (1987) | Wilson & Patterson (1968) | Zell & Bernstein (2014) | |
|---|---|---|---|---|---|---|---|---|---|---|
| DeWitte (1990) | 0.00 | 0.10 | 0.14 | 0.21 | 0.25 | 0.17 | 0.19 | 0.20 | 0.24 | 0.16 |
| Everett (2013) | 0.10 | 0.00 | 0.17 | 0.24 | 0.20 | 0.36 | 0.13 | 0.27 | 0.21 | 0.43 |
| Feldman & Johnston (2014) | 0.14 | 0.17 | 0.00 | 0.15 | 0.09 | 0.30 | 0.57 | 0.16 | 0.10 | 0.27 |
| Henningham (1996) | 0.21 | 0.24 | 0.15 | 0.00 | 0.00 | 0.25 | 0.12 | 0.32 | 0.30 | 0.24 |
| Henningham (1997) | 0.25 | 0.20 | 0.09 | 0.00 | 0.00 | 0.21 | 0.15 | 0.18 | 0.04 | 0.29 |
| Inbar et al. (2009) | 0.17 | 0.36 | 0.30 | 0.25 | 0.21 | 0.00 | 0.33 | 0.29 | 0.12 | 0.36 |
| Layman & Carsey (2002) | 0.19 | 0.13 | 0.57 | 0.12 | 0.15 | 0.33 | 0.00 | 0.14 | 0.08 | 0.21 |
| Sidanius (1987) | 0.20 | 0.27 | 0.16 | 0.32 | 0.18 | 0.29 | 0.14 | 0.00 | 0.42 | 0.33 |
| Wilson & Patterson (1968) | 0.24 | 0.21 | 0.10 | 0.30 | 0.04 | 0.12 | 0.08 | 0.42 | 0.00 | 0.16 |
| Zell & Bernstein (2014) | 0.16 | 0.43 | 0.27 | 0.24 | 0.29 | 0.36 | 0.21 | 0.33 | 0.16 | 0.00 |
Summary & Comparison
Comparison of Topic Frequencies
Item and Categories
References
Atkinson, K. M., Koenka, A. C., Sanchez, C. E., Moshontz, H., & Cooper, H. (2015). Reporting standards for literature searches and report inclusion criteria: making research syntheses more transparent and easy to replicate. Research Synthesis Methods, 6 (1), 87-95. doi: 10.1002/jrsm.1127
De Witte, H. (1990). Conformisme, radicalisme en machteloosheid: Een onderzoek naar de sociaal-culturele en sociaal-economische opvattingen van arbeiders in vlaanderen [conformism, radicalism and powerlessness: In search of socio-cultural and socioeconomical attitudes among workers in Flanders]. K. U. Leuven, HIVA.
Everett, J. A. (2013). The 12 item social and economic conservatism scale (SECS). PloS one, 8 (12), e82131. doi: 10.1371/journal.pone.0082131
Feldman, S., & Johnston, C. (2014). Understanding the determinants of political ideology: Implications of structural complexity. Political Psychology, 35 (3), 337-358. doi: 10.1111/pops.12055
Fried, E. I. (2017). The 52 symptoms of major depression: Lack of content overlap among seven common depression scales. Journal of affective disorders, 208, 191-197.
Henningham, J. P. (1996). A 12-item scale of social conservatism. Personality and Individual Differences, 20 (4), 517-519. doi: 10.1016/0191-8869(95)00192-1
Henningham, J. P. (1997). A short scale of economic conservatism. Psychological Reports, 81 (3), 1019-1024. doi: 10.2466/pr0.1997.81.3.1019
Inbar, Y., Pizarro, D. A., & Bloom, P. (2009). Conservatives are more easily disgusted than liberals. Cognition & Emotion, 23 (4), 714-725. doi: 10.1080/02699930802110007
Jaccard, P. (1901). Distribution de la flore alpine dans le Bassin des Drouces et dans quelques regions voisines. Bulletin de la Société Vaudoise des Sciences Naturelles, 37(140), 241– 272.
Jalali, S., & Wohlin, C. (2012). Systematic literature studies: Database searches vs. backward snowballing. In Proceedings of the 2012 acm-ieee international symposium on empirical software engineering and measurement (pp. 29-38). doi: 10.1145/2372251.2372257
Kitchenham, B., & Charters, S. (2007). Guidelines for performing systematic literature reviews in software engineering. Citeseer.
Layman, G. C., & Carsey, T. M. (2002). Party polarization and conflict extension in the american electorate. American Journal of Political Science, 786-802. doi: 10.2307/3088434
Pew Research Center. (2012, August, 24).* Political party quiz: How we placed you*. Retrieved from http://www.people-press.org/2012/08/24/political-party -quiz-how-we-placed-you/
Sidanius, J. (1987). Social attitudes and political party preference among Swedish youth. Scandinavian Political Studies, 10 (2), 111-124.
Strauss, A. (1987). Qualitative analysis for social scientists. Cambridge: University Press.
Strauss, A, & Corbin, J. (1990). Basics of qualitative research. Grounded theory procedures and techniques. Newbury Park: Sage.
Webster, J., & Watson, R. T. (2002). Analyzing the past to prepare for the future: Writing a literature review. MIS Quarterly, xiii-xxiii.
Wilson, G. D., & Patterson, J. R. (1968). A new measure of conservatism. British Journal of Social and Clinical Psychology, 7 (4), 264-269. doi: 10.1111/j.2044-8260.1968.tb00568.x
Zell, E., & Bernstein, M. J. (2014). You may think you’re right. . . young adults are more liberal than they realize. Social Psychological and Personality Science, 5 (3), 326-333. doi: 10.1177/1948550613492825
Social Sciences